
Three core issues were examined to determine ongoing relevance of the Program: continued need for the program, alignment with Government of Canada priorities, and alignment with federal roles and responsibilities. The evaluation assessed the relevance of the overall Program as well as its sub-components.
3.1 Continued Need for the Program
There is a continued need for the Financial Benefits program.
Uptake and Expenditures
Program uptake and expenditures indicate continued need. Overall, the Program recipients and expenditures have increased and that growth is forecasted to continue. As shown in Chart 1, between 2010-11 and 2014-15, the number of recipients increased by 307% (from 2,196 to 8,935) and is forecasted to increase by 49% from 2015-16 to 2018-19 (from 11,245 to 16,705, respectively).
Chart 1 - Financial Benefits Recipients, 2010-11 to 2018-19
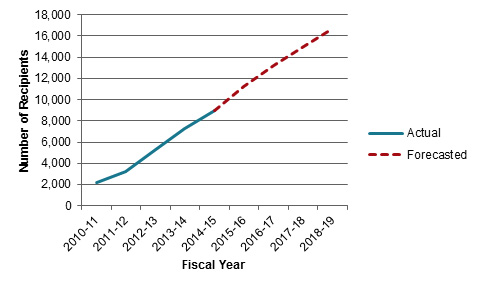
Chart 1 - Financial Benefits Recipients, 2010-11 to 2018-19
| Fiscal Year | Number of Recipients |
|---|---|
| 2010-11 (A) | 2196 |
| 2011-12 (A) | 3257 |
| 2012-13 (A) | 5280 |
| 2013-14 (A) | 7229 |
| 2014-15 (A)(F) | 8935 |
| 2015-16 (F) | 11245 |
| 2016-17 (F) | 13240 |
| 2017-18 (F) | 14974 |
| 2018-19 (F) | 16705 |
Source: VAC Finance Division. It should be noted that the total number of recipients includes the number of recipients of each of the Financial Benefits Programs. An individual may be receiving multiple Financial Benefits, therefore, would be counted multiple times based on the number of benefits received.
Expenditures followed a similar growth trend. As illustrated in Chart 2, expenditures increased 363% in the five-year period ending 2014-15 (from $40M to $186MFootnote 14). A further increase of 44% is forecasted from 2015-16 to 2018-19 ($220M to $317M, respectively).
Chart 2 - Financial Benefit Expenditures, 2010-11 to 2018-19
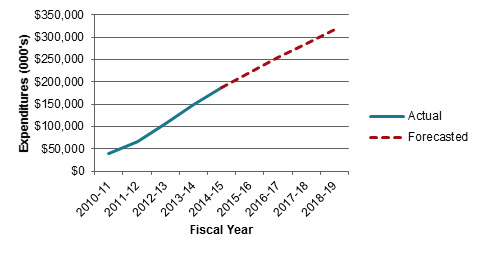
Chart 2 - Financial Benefit Expenditures, 2010-11 to 2018-19
| Fiscal Year | Expenditures (000's) |
|---|---|
| 2010-11 (A) | $40,260 |
| 2011-12 (A) | $65,129 |
| 2012-13 (A) | $105,328 |
| 2013-14 (A) | $149,714 |
| 2014-15 (A)(F) | $186,276 |
| 2015-16 (F) | $220,267 |
| 2016-17 (F) | $253,807 |
| 2017-18 (F) | $285,316 |
| 2018-19 (F) | $317,196 |
Source: VAC Finance Division.
To further examine need, the evaluation team assessed program uptake and/or expenditures relating to Program components.
Earnings Loss Benefit
ELB has also seen a growth. As presented in Chart 3, ELB recipients have increased 124%, from 2,156 in 2010-11 to 4,823 in 2014-15.
Chart 3 - Earnings Loss Benefit Recipients, 2010-11 to 2018-19
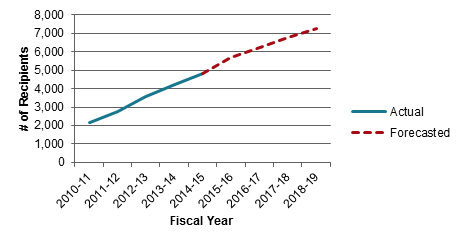
Chart 3 - Earnings Loss Benefit Recipients, 2010-11 to 2018-19
| Fiscal Year | Number of Recipients |
|---|---|
| 2010-11 (A) | 2156 |
| 2011-12 (A) | 2767 |
| 2012-13 (A) | 3588 |
| 2013-14 (A) | 4215 |
| 2014-15 (A)(F) | 4823 |
| 2015-16 (F) | 5700 |
| 2016-17 (F) | 6240 |
| 2017-18 (F) | 6760 |
| 2018-19 (F) | 7270 |
Source: VAC Finance Division.
Chart 4 illustrates an expenditure increase of 278%, from $40M in 2010-11 to $151M in 2014-15. The forecast reflects future increased demand.
Chart 4 - Earnings Loss Benefit Expenditures, 2010-11 to 2018-19
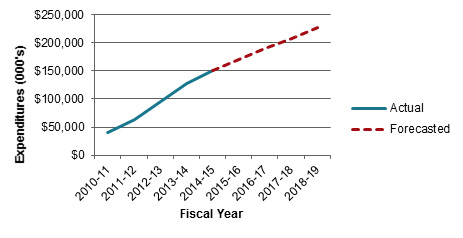
Chart 4 - Earnings Loss Benefit Expenditures, 2010-11 to 2018-19
| Fiscal Year | Expenditures (000's) |
|---|---|
| 2010-11 (A) | $40,069 |
| 2011-12 (A) | $63,756 |
| 2012-13 (A) | $94,727 |
| 2013-14 (A) | $127,151 |
| 2014-15 (A)(F) | $151,351 |
| 2015-16 (F) | $170,132 |
| 2016-17 (F) | $189,072 |
| 2017-18 (F) | $207,773 |
| 2018-19 (F) | $226,375 |
Source: VAC Finance Division.
Permanent Impairment Allowance and Supplement
PIA has increased from 32 recipients in 2010-11 to 2,293 recipients in 2014-15. Moreover, PIA grew by 781% in 2011-12, the year PIAS was introduced, and 713% from 2011-12 to 2014-15. PIAS has also increased, from 196 recipients in its first year in 2011-12 to 1,755 in 2014-15. Demand for the benefit is forecasted to continue in the future. Chart 5 illustrates the growth of both components.
Chart 5 - PIA and PIAS Recipients, 2010-11 to 2014-15
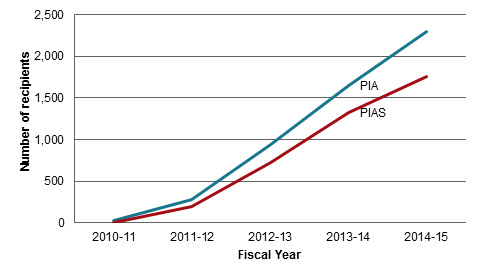
Chart 5 - PIA and PIAS Recipients, 2010-11 to 2014-15
| Fiscal Year | Number of Recipients | |
|---|---|---|
| PIA | PIAS | |
| 2010-11 (A) | 32 | 0 |
| 2011-12 (A) | 282 | 196 |
| 2012-13 (A) | 941 | 727 |
| 2013-14 (A) | 1647 | 1320 |
| 2014-15 (F) | 2293 | 1755 |
Source: VAC Finance Division.
Canadian Forces Income Support
Though the number of recipients benefiting from CFIS is relatively low (representing 0.6% of all program recipients), the program is growing. In 2014-15, there were 43 CFIS program recipients (up from five in 2010-11). Participant numbers are expected to increase to 105 in 2018-19.
Supplementary Retirement Benefit
The number of SRB recipients increased from three in 2010-11 to 21 in 2014-15, with approximately $2,400 being the medianFootnote 15 amount paid. As explained in Subsection 3.1, eligibility for SRB is tied to the applicant being deemed TPI.
Program uptake is expected to increase in the future as more Veterans join the Rehabilitation Program, as more Rehabilitation participants are deemed TPI, and as those deemed TPI age. At March 31, 2015, the median age of Rehabilitation Program participants was 49 years old, the median age of participants being deemed TPI was 52 years, and 22% of all program recipients were TPI. The number of Rehabilitation participants deemed TPI annually and the cumulative number of TPI Veterans have both more than tripled over the last two years.
Program Enhancements
Program enhancements also point to continued need. A number of these enhancements, as follows, were implemented in response to feedback from the House of Commons Standing Committee on Veterans Affairs (ACVA)Footnote 16, from Veterans, and other key stakeholders.
- Increase in the minimum amount paid under the ELB;
- Expand PIA to “seriously disabled” Veterans who receive both a Disability Award and a pension under the Pension Act. These Veterans were previously excluded due to an administrative deficiency that affected both the PIA and the Exceptional Incapacity Allowance provided for under the Pension Act; and
- Implementing an increase to the PIA, known as the PIA Supplement.
Further, as the result of a Regulatory amendment in 2011, VAC no longer deducts Disability Pension amounts from the monthly ELB.
Financial benefits programs in Allied countries
Other countries have also recognized the need to provide financial benefits to Veterans. Some jurisdictions compensate for earnings loss by recognizing varying degrees of work capacity and are designed to encourage labour market participation. Both Australia and the United Kingdom (UK) have programs similar to VAC’s. In Australia, Veterans can choose between loss of earnings capacity compensation or impairment-based compensation. As in Canada, the earnings loss benefits end at age 65. UK benefits are adjusted for age and severity of disability with earnings loss benefits continuing for life. These alternate approaches to program delivery will be assessed as part of an upcoming NVC Rehabilitation and Financial Benefits Evaluation slated to begin in 2018-19. Appendix C compares VAC financial benefits with those from Australia and the UK.
Overlap/duplication
The Program does not duplicate or overlap with other programs. Though numerous income replacement and support programs, delivered by other organizations, exist – e.g., Service Income Security Insurance Plan Long-term Disability Insurance, Provincial Workers Compensation and Employment Insurance Regular Benefits – VAC deducts all relevant sources of income received through these programs from the amount of ELB payable. Therefore, while these programs have similarities, financial benefits offered by VAC are designed to enhance, not duplicate, various services found elsewhere for Veterans.
3.2 Alignment with Government Priorities
The Financial Benefits Program is aligned with government priorities.
The Program is aligned with Government of Canada priorities. The 2015 Speech from the Throne noted that “the Government will do more to support them [Veterans] and their families.” Priorities relating to the Program were also reflected in the 2015 Budget; i.e., implementing RISB, expanding access to PIA, and modifying ELB for part-time Reserve Force Veterans.
The Program recognizes and compensates for the economic impact that a career-ending and/or service-related disability may have on a Veteran’s ability to earn income following release from the CAF. Thus, it aligns with the Department’s strategic outcome of “Financial, physical and mental well-being of eligible Veterans”Footnote 17.
3.3 Alignment with Federal Roles and Responsibilities
The Financial Benefits Program is aligned with federal roles and responsibilities.
The Program is aligned with VAC’s mandate, as defined in legislation and regulations. Most significantly, the Program fulfills the legislative requirement as per the Department of Veterans Affairs Act, Section 4(a)(i), to provide for:
“the care, treatment or re-establishment in civil life of any person who served in the Canadian Forces or merchant navy or in the naval, army or air forces or merchant navies of Her Majesty, of any person who has otherwise engaged in pursuits relating to war, and of any other person designated by the Governor in Council; and
the care of the dependants or survivors of any person referred to in subparagraph (i).”
The Program was designed to recognize and compensate for the economic impacts of any injury or illness which resulted primarily from service or leading to a medical release. As such, it contributes to reestablishment in civilian life.
VAC’s Five-Year Strategic Plan – Care, Compassion and Respect – lays out a new direction that will significantly change and improve how the Department serves and cares for VeteransFootnote 18. The plan has three core objectives, Veteran CentricFootnote 19, Seamless Transition and Service Excellence, which were considered in the evaluation of the Program.