
Actual expenditures
Departmental spending trend graph
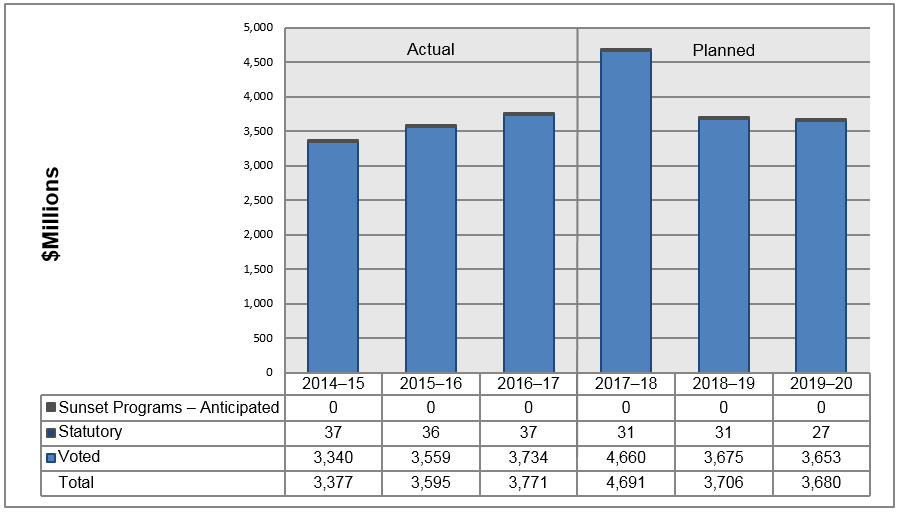
Departmental spending trend ($ millions) – Table
| Spending | 2014–15 Actual |
2015–16 Actual |
2016–17 Actual |
2017–18 Planned |
2018–19 Planned |
2019–20 Planned |
|---|---|---|---|---|---|---|
| Sunset Programs – Anticipated | 0 | 0 | 0 | 0 | 0 | 0 |
| Statutory Programs | 37 | 36 | 33 | 31 | 31 | 27 |
| Voted | 3,340 | 3,559 | 3,734 | 4,660 | 3,675 | 3,653 |
| Total Spending | 3,377 | 3,595 | 3,771 | 4,691 | 3,706 | 3,680 |
Note: Some totals may not add up due to rounding.
| Programs and Internal Services | 2016–17 Main Estimates |
2016–17 Planned spending | 2017–18 Planned spending | 2018–19 Planned spending | 2016–17 Total authorities available for use |
2016–17 Actual spending (authorities used) |
2015–16 Actual spending (authorities used) |
2014–15 Actual spending (authorities used) |
|---|---|---|---|---|---|---|---|---|
| 1.1 Disability and Death Compensation | 2,141,757,279 | 2,141,757,279 | 2,853,756,218 | 2,018,239,398 | 2,150,227,883 | 2,108,339,210 | 2,143,780,278 | 2,017,365,900 |
| 1.2 Financial Support Program | 278,039,229 | 278,039,229 | 572,051,974 | 501,353,032 | 408,183,507 | 365,983,197 | 246,513,877 | 205,167,882 |
| 1.3 Health Care Program and Re-establishment Services | 1,089,248,862 | 1,089,248,862 | 1,141,330,144 | 1,067,159,666 | 1,204,053,150 | 1,155,509,888 | 1,070,454,796 | 1,026,146,338 |
| 2.1 Canada Remembers Program | 46,317,506 | 46,317,506 | 45,585,347 | 41,494, 828 | 59,508,363 | 55,553,811 | 50,028,142 | 45,528,370 |
| 3.1 Veterans Ombudsman | 5,306,217 | 5,306,217 | 5,234,308 | 5,234,308 | 5,205,392 | 4,630,182 | 4,600,441 | 4,578,484 |
| Subtotal | 3,560,669,093 | 3,560,669,093 | 4,617,957,991 | 3,633,481,232 | 3,827,178,295 | 3,690,016,288 | 3,515,377,534 | 3,298,786,974 |
| Internal Services | 67,612,609 | 67,612,609 | 73,441,591 | 72,308,921 | 87,252,281 | 80,792,453 | 79,656,670 | 78,092,980 |
| Total | 3,628,281,702 | 3,628,281,702 | 4,691,399,582 | 3,705,790,153 | 3,914,430,576 | 3,770,808,741 | 3,595,034,204 | 3,376,879,954 |
Veterans Affairs Canada builds its annual budget so the Department can fully respond to eligible Veterans in need of benefits and services. A key part of this process is forecasting, which helps ensure there is enough funding for all eligible Veterans who are likely to need help in a given year. Naturally, the Department’s budget fluctuates each year due to the demand-driven nature of its programs, which are based on Veterans’ needs and entitlements. In other words, a Veteran who is entitled to a benefit is paid that benefit, whether 10 Veterans come forward or 10,000.
While forecasting helps ensure enough funding is available, expenditures are only incurred for Veterans who in fact come forward to use the program or service. The Government’s budget process is designed to account for these fluctuations as a normal part of providing programs and services for Canadian Veterans which is why there will be changes to both forecasted and actual spending from one year to the next. It is important to note that fluctuations in spending are normal, given that initial forecasting is typically done many months in advance of the reporting period and adjusted throughout the year based on actual results.
As shown in the financial tables, the Department spent $3.8 billion in 2016–17, of which over 90% represented payments to Veterans, their families, and other program recipients. The difference between planned spending and actual spending (an increase of $143 million) can be largely attributed to an increase in spending on Earnings Loss Benefits as committed in Budget 2016. On October 1st 2017, the Earnings Loss Benefit increased from 75% to 90% of a Veteran’s pre-release salary; this funding was not included in the planned spending figures at the start of the fiscal year.
VAC is forecasting to increase spending by 24% ($920 million) in 2017–18, when compared with actual spending in 2016–17. The majority of this increase is related to the Budget 2016 commitment to ensure the long-term financial security of disabled Veterans.
While planned spending is currently shown to decrease in the outer years (2018–19 and 2019–20), it is expected the Department will see increased demand for many of its programs and services. Any required adjustments to the budget will be made in future years.
Overall, the Department continues to see an increase in the number of CAF Veterans and their families benefiting from VAC programs. At the same time, the number of war-service Veterans is declining, with surviving spouses becoming a larger segment of the population being served.
Actual human resources
| Programs and Internal Services | 2014–15 Actual |
2015–16 Actual |
2016–17 Planned |
2016–17 Actual |
2017–18 Planned |
2018–19 Planned |
|---|---|---|---|---|---|---|
| 1.1 Disability and Death Compensation | 632.0 | 645.3 | 727.0 | 715.6 | 773.3 | 747.7 |
| 1.2 Financial Support Program | 42.1 | 49.9 | 60.0 | 74.2 | 89.1 | 86.1 |
| 1.3 Health Care Program and Re-establishment Services | 1,473.2 | 1,599.0 | 984.0 | 1,097.5 | 1,194.7 | 1,155.2 |
| 2.1 Canada Remembers Program | 90.2 | 83.7 | 94.0 | 91.0 | 89.7 | 91.5 |
| 3.1 Veterans Ombudsman | 33.4 | 33.8 | 38.0 | 32.0 | 38.0 | 38.0 |
| Subtotal | 2,270.9 | 2,411.7 | 1,903.0 | 2,010.3 | 2,184.8 | 2,118.5 |
| Internal Services | 635.6 | 597.8 | 706.0 | 626.0 | 655.9 | 651.9 |
| Total | 2,906.5 | 3,009.4 | 2,609.0 | 2,636.2 | 2,840.7 | 2,770.4 |
During 2016–17, the Department experienced an increase in its human resources due to the culmination of several initiatives that were undertaken over the last three years, including: increased Case Management Services; the creation of three new benefits (Retirement Income Security Benefit, Critical Injury Benefit and Family Caregiver Relief Benefit); increased Financial Benefits for Veterans (including Reservists); investments in mental health; and the re-opening of Veterans Affairs offices across the country. However, this increase was offset by a decrease of 738 FTEs due to the transfer of Sainte Anne’s Hospital to the province of Quebec as of April 1, 2016.
Going forward, human resources at VAC will support improvements to Health Care and Re-establishment Services program, as well as financial and disability benefits. These improvements will help ensure long-term financial security for disabled Veterans while providing compensation for pain and suffering.
Full time equivalents for the Disability and Death Compensation Program have increased steadily since 2015–16. Additional resources have been established to deliver on VAC’s Disability Award increases, to adjudicate and process an increased volume of disability benefits, and to improve front line services in the newly re-opened offices across the country.
As a result of Budget 2016 commitments, VAC has increased human resources in the Financial Support Program by over 23%. These resources have been put in place to support the increase to the Earnings Loss Benefit to 90% of pre-release salary, while also expanding access to the Career Impact Allowance (formerly known as the Permanent Impairment Allowance).
In 2016–17, VAC increased the number of human resources in the Health Care program and Re-establishment Services by over 113 FTEs. This is a direct result of VAC’s commitments to improve front line services and to increase and improve benefits to Veterans across the country. These additional resources represent new front line staff such as Case Managers, Veteran Service Agents, as well as employees located in the area offices re-opened as part of Budget 2016.
While human resources in the Canada Remembers Program are stable in 2016–17, additional expert resources were recruited from across the Department on a temporary basis to prepare to successfully commemorate a major First World War milestone – the 100th Anniversary of the Battle of Vimy Ridge.
Human resources for the Veterans Ombudsman remain relatively stable and no changes are expected in the coming years.
For Internal Services, VAC’s resources have decreased as a proportion of VAC’s overall human resources. Internal Services decreased from 29.4% of FTEs in 2014–15, to 23.7% in 2016–17. This decrease was a result of the Department’s effort to focus its new resources towards the delivery of services to Veterans, as well as improved efficiencies and the streamlining of internal business processes.
Expenditures by vote
For information on Veterans Affairs Canada organizational voted and statutory expenditures, consult the Public Accounts of Canada 2017.
Alignment of spending with the whole-of-government framework
| Program | Spending area | Government of Canada activity | 2016–17 Actual spending |
|---|---|---|---|
| 1.1 Disability and Death Compensation | Economic Affairs | Income Security and Employment for Canadians | 2,108,339,210 |
| 1.2 Financial Support Program | Economic Affairs | Income Security and Employment for Canadians | 365,983,197 |
| 1.3 Health Care Program and Re-establishment Services | Social Affairs | Healthy Canadians | 1,155,509,888 |
| 2.1 Canada Remembers Program | Social Affairs | A Vibrant Canadian Culture and Heritage | 55,553,811 |
| 3.1 Veterans Ombudsman | Economic Affairs | Income Security and Employment for Canadians | 4,630,182 |
| Spending area | Total planned spending | Total actual spending |
|---|---|---|
| Economic Affairs | 2,425,102,725 | 2,478,952,589 |
| Social Affairs | 1,135,566,368 | 1,211,063,699 |
| International Affairs | – | – |
| Government Affairs | – | – |
Financial statements and financial statements highlights
Financial statements
VAC’s financial statements (unaudited) for the year ended March 31, 2017 are available on the Department’s website.
Financial statement highlights
| Financial information | 2016–17 Planned results |
2016–17 Actual |
2015–16 Actual |
Difference (2016–17 actual minus 2016–17 planned) | Difference (2016–17 actual minus 2015–16 planned) |
|---|---|---|---|---|---|
| Total expenses | 3,615,326,599 | 3,717,205,470 | 3,622,681,949 | 101,878,871 | 94,523,521 |
| Total revenues | 0 | 16,945 | 23,213 | 16,945 | (6,268) |
| Net cost of operations before government funding and transfers | 3,615,326,599 | 3,717,188,525 | 3,622,658,736 | 101,861,926 | 94,529,789 |
The expenses of the Department for 2016–17 increased by $95 million in comparison to those in 2015–16.
Departmental spending in 2016–17 was higher than planned as Parliament subsequently authorized additional funding through the Estimates process for New Veterans Charter programs such as Disability Awards and Earnings Loss and Supplementary Retirement Benefits. These increases were offset by a decrease in Disability Pensions. Changing demographics in the Veteran population means that uptake of programs for war-service Veterans is decreasing while uptake for New Veterans Charter programs continues to increase.
| Financial information | 2016–17 | 2016–17 | Difference (2016–17 minus 2015–16) |
|---|---|---|---|
| Total net liabilities | 158,486,205 | 221,335,542 | (62,849,337) |
| Total net financial assets | 139,245,848 | 139,298,858 | (53,010) |
| Departmental net debt | 19,240,357 | 82,036,684 | (62,796,327) |
| Total non-financial assets | 13,553,992 | 9,225,018 | 4,328,974 |
| Departmental net financial position | (5,686,365) | (72,811,666) | 67,125,301 |
- Total net liabilities:
- Total net liabilities have decreased by $62.8 million in 2016–17 compared to 2015–16.
This variance is explained by a decrease in Ste. Anne’s Hospital transfer liability and a decrease in account payable and accrued liabilities. - Total net financial assets:
- Total net financial assets have slightly decreased in 2016–17 compared to 2015–16.
- Departmental net debt:
- Departmental net debt, which is the difference between net liabilities and net financial assets, has decreased by $62.8 million in 2016–17 compared to 2015–16.
- Total non-financial assets:
- Total non-financial assets have increased by $4.3 million in 2016–17 compared to 2015–16.
This variance is explained by an increase in tangible capital assets, primarily related to the construction of the new Vimy Education Centre in France.