
Actual expenditures
Departmental spending trend graph
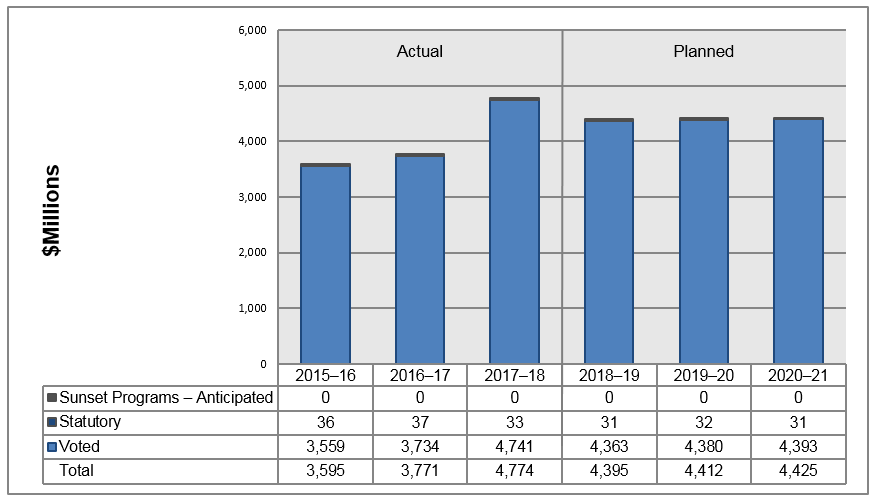
Departmental spending trend graph ($millions) - Table
| Categories | Actual 2015-2016 |
Actual 2016-2017 |
Actual 2017-2018 |
Planned 2018-2019 |
Planned 2019-2020 |
Planned 2020-2021 |
|---|---|---|---|---|---|---|
| Sunset Programs - Anticipated | 0 | 0 | 0 | 0 | 0 | 0 |
| Statutory Programs | 36 | 37 | 33 | 31 | 32 | 31 |
| Voted | 3,559 | 3,734 | 4,741 | 4,363 | 4,380 | 4,393 |
| Total Spending | 3,595 | 3,771 | 4,774 | 4,395 | 4,412 | 4,425 |
Budgetary performance summary for Programs and Internal Services (dollars)
| Programs and Internal Services | 2017–18 Main Estimates | 2017–18 Planned spending | 2018–19 Planned spending | 2019–20 Planned spending | 2017–18 Total authorities available for use | 2017–18 Actual spending (authorities used) | 2016–17 Actual spending (authorities used) | 2015–16 Actual spending (authorities used) |
|---|---|---|---|---|---|---|---|---|
| 1.1 Disability and Death Compensation | 2,853,756,218 | 2,853,756,218 | 2,342,536,393 | 2,340,379,279 | 2,985,375,267 | 2,961,484,926 | 2,108,339,210 | 2,143,780,278 |
| 1.2 Financial Support Program | 572,051,974 | 572,051,974 | 669,717,231 | 684,913,466 | 578,619,992 | 561,209,710 | 365,983,197 | 246,513,877 |
| 1.3 Health Care Program and Re-establishment Services | 1,141,330,144 | 1,141,330,144 | 1,251,209,760 | 1,258,812,712 | 1,208,890,663 | 1,104,583,422 | 1,155,509,888 | 1,070,454,796 |
| 2.1 Canada Remembers Program | 45,585,347 | 45,585,347 | 42,409,890 | 40,333,490 | 59,061,276 | 56,866,415 | 55,553,811 | 50,028,142 |
| 3.1 Veterans Ombudsman | 5,234,308 | 5,234,308 | 5,386,623 | 5,386,623 | 5,453,873 | 4,960,234 | 4,630,182 | 4,600,441 |
| Subtotal | 4,617,957,991 | 4,617,957,991 | 4,311,259,897 | 4,329,825,570 | 4,837,401,071 | 4,689,104,707 | 3,690,016,288 | 3,515,377,534 |
| VAC Internal Services | 73,441,591 | 73,441,591 | 83,294,535 | 82,137,640 | 85,135,796 | 84,786,373 | 80,792,453 | 79,656,670 |
| Total | 4,691,399,582 | 4,691,399,582 | 4,394,554,432 | 4,411,963,210 | 4,922,536,867 | 4,773,891,080 | 3,770,808,741 | 3,595,034,204 |
We build our annual budget so our Department can respond adequately to Veterans in need of benefits and services. Accurate forecasting is important, as it helps ensure that there is enough funding for all eligible Veterans who are likely to need help in a given year. The Department's budget fluctuates each year because its programs are based on Veterans' needs and entitlements. Simply put, a Veteran who is entitled to a benefit will be paid that benefit, no matter how many Veterans come forward in a year.
As shown in the financial tables, VAC spent $4.8 billion in 2017–18. Of that budget, 90% covered payments to or on behalf of Veterans, their families, and other program recipients. The difference between planned spending and actual spending (actual spending is $82.5 million higher) occurred because the Department encountered more expenses than were originally forecast for Disability Awards and for the Invictus Games.
We expect spending to decrease by approximately 8% (i.e., $379 million) in 2018–19 from the previous year. The decrease is a result of the nature of the Disability Awards paid in 2017–18. The Budget 2016 change to Disability Awards required that a one-time retroactive payment be made to all Veterans who had received an award after the introduction of the New Veterans Charter in 2006. Our Department made these payments in 2017–18. Our budget for 2018–19 therefore does not account for those expenses.
Actual spending has increased since 2015–16 as a result of program enhancements to provide better services to Veterans. Planned spending will increase in 2019–20 and 2020–21. This increase is a result of the growing number of CAF Veterans and families who access VAC's programs and services. We have increased our efforts to reach more Veterans not currently served by our Department, which in turn increases the number of clients we serve. We can seek the necessary funding for this demand through future estimate cycles that make sure that all Veterans receive the benefits and supports to which they are entitled.
Actual human resources
Human resources summary for Programs and Internal Services (full time equivalents [FTE])Footnote 5
| Programs and Internal Services | 2015–16 Actual | 2016–17 Actual | 2017–18 Planned | 2017–18 Actual | 2018–19 Planned | 2019–20 Planned |
|---|---|---|---|---|---|---|
| 1.1 Disability and Death Compensation | 645.3 | 715.6 | 773.2 | 743.7 | 747.7 | 752.3 |
| 1.2 Financial Support Program | 49.9 | 74.2 | 89.1 | 77.1 | 86.1 | 86.6 |
| 1.3 Health Care Program and Re-establishment Services | 1,599.0 | 1,097.5Footnote 6 | 1,194.7 | 1,140.6 | 1,155.2 | 1,162.2 |
| 2.1 Canada Remembers Program | 83.7 | 91.0 | 89.7 | 88.4 | 91.5 | 92.4 |
| 3.1 Veterans Ombudsman | 33.8 | 32.0 | 38.0 | 34.1 | 38.0 | 38.0 |
| Subtotal | 2,411.7 | 2,010.3 | 2,184.7 | 2,083.9 | 2,118.5 | 2,131.5 |
| Internal Services | 597.8 | 626.0 | 655.9 | 645.8 | 651.9 | 652.4 |
| Total | 3,009.4 | 2,636.2 | 2,840.5 | 2,729.7 | 2,770.4 | 2,783.9 |
Our Department hired 4% more service delivery staff in 2017–18 (74.1 FTEs in Programs 1.1, 1.2, and 1.3 combined) than in 2016–17. Although we planned to hire more people in 2017–18, unexpected delays meant that many of our new hires arrived late in the fiscal year. We hired more people as part of the Budget 2017 initiative to improve service to Veterans and their families.
Going forward, these new hires will help us improve the Health Care and Re-establishment Services program and financial and disability benefits. Improvements to these programs will help ensure long-term financial security for disabled Veterans while providing compensation for pain and suffering.
The number of full-time equivalent staff members for the Disability and Death Compensation Program has increased steadily since 2015–16. We have 15% more staff in this program than we did before 2015 and these employees directly contribute to the delivery of VAC's Disability Award increases, to the adjudication and processing of increased volume of disability benefits, and to front-line services across the country.
We increased the number of employees in the Financial Support Program by almost 4% in 2017–18. We have seen a significant increase since 2015–16 due to program enhancements to provide better services to Veterans. Resources continue to be put in place to support the new Education and Training Benefit, Career Transition Services and the Veterans Well-Being Fund.
The Department hired 43 FTEs in the Health Care Program and Re-establishment Services in 2017–18. These hires were part of our ongoing efforts to improve front-line services and to increase and improve benefits for Veterans across the country.
The number of employees in the Canada Remembers Program and the Veterans Ombudsman remained relatively stable in 2017–18.
We slightly increased the number of staff members in Internal Services (3.2%) in line with VAC's overall increases to front-line human resources.
Expenditures by vote
For information on Veterans Affairs Canada's organizational voted and statutory expenditures, consult the Public Accounts of Canada 2017–2018.
Government of Canada spending and activities
Information on the alignment of VAC's spending with the Government of Canada's spending and activities is available in the GC InfoBase.
Financial statements and financial statements highlights
Financial statements
VAC's financial statements (unaudited) for the year ended March 31, 2018 are available on the Department's website.
Financial statements highlights
Condensed statement of operations (unaudited) for the year ended March 31, 2018 (dollars)
| Financial information | 2017–18 Planned results |
2017–18 Actual |
2016–17 Actual |
Difference (2017–18 actual minus 2017–18 planned) | Difference (2017–18 actual minus 2016–17 actual) |
|---|---|---|---|---|---|
| Total expenses | 4,702,059,747 | 4,789,380,985 | 3,717,205,470 | 87,321,238 | 1,072,175,515 |
| Total revenues | – | 9,380 | 16,945 | 9,380 | (7,565) |
| Net cost of operations before government funding and transfers | 4,702,059,747 | 4,789,371,605 | 3,717,188,525 | 87,311,858 | 1,072,183,080 |
Expenses increased by $1 billion in 2017–18 in comparison to the previous year. This increase is primarily a result of the Budget 2016 commitment to increase the maximum Disability Award to $360,000. It is also related to the top-up payments made to all Veterans who received a Disability Award since April 1, 2006 and to an overall increase in demand for Disability Awards. Another factor is the Budget 2016 commitment to increase the Earnings Loss Benefit to 90% of the recipient's pre-release military salary.
Departmental spending in 2017–18 was higher than planned. Parliament authorized additional funding for New Veterans Charter programs, such as Disability Awards, Earnings Loss and Supplementary Retirement Benefits. Decreases to Disability Pensions offset these expenses. Changing demographics in the Veteran population means that programs for war-service Veterans receive fewer applications while New Veterans Charter programs receive increasing numbers of applications.
Condensed Statement of Financial Position (unaudited) as of March 31, 2018 (dollars)
| Financial information | 2017–2018 | 2016–2017 | Difference (2017–18 minus 2016–17) |
|---|---|---|---|
| Total net liabilities | 160,981,234 | 158,486,205 | 2,495,029 |
| Total net financial assets | 147,690,729 | 139,245,848 | 8,444,881 |
| Departmental net debt | 13,300,505 | 19,240,357 | (5,939,852) |
| Total non-financial assets | 13,402,972 | 13,553,992 | (151,020) |
| Departmental net financial position | (102,467) | (5,686,365) | 5,583,898 |
Total net liabilities increased by $2.5 million in 2017–18 compared to 2016–17. This change is a result of a decrease in Ste. Anne's Hospital transfer liability and an increase in payable accounts and accrued liabilities.
Total net financial assets increased in 2017–18 compared to 2016–17.
The net debt of the Department, which represents the difference between net liabilities and net financial assets, decreased by $5.9 million in 2017–18 compared to 2016–17.
Total non-financial assets decreased in 2017–18 compared to 2016–17. The decrease is a result of amortization of tangible capital assets.