
This publication is available upon request in alternate formats.
PDF Version
Kristen Simkus, MPH, Epidemiologist, VAC
Linda VanTil, DVM MSc, Epidemiologist, VAC
David Pedlar, PhD, Director Research, VAC
Research Directorate
Veterans Affairs Canada
Charlottetown PE Canada
Email: VAC.Research-Recherche.ACC@vac-acc.gc.ca
November 30, 2017
Research Directorate Technical Report
© Her Majesty the Queen in Right of Canada, 2017.
ISBN: 978-0-660-24039-8
Catalogue #: V32-346/2017E-PDF
Published by:
Veterans Affairs Canada
161 Grafton Street
Charlottetown, Prince Edward Island
C1A 8M9
Email: VAC.Research-Recherche.ACC@vac-acc.gc.ca
Authors:
Kristen Simkus, MPH, Epidemiologist, VAC
Linda VanTil, DVM MSc, Epidemiologist, VAC
David Pedlar, PhD, Director Research, VAC
Thank you to the Health Statistics Division, Statistics Canada; Dr. Elizabeth Rolland-Harris, DND; and Dr. Jim Thompson, VAC for contributing their expertise to this study.
Citation:
Simkus K, VanTil L, Pedlar D. 2017 Veteran Suicide Mortality Study: 1976 to 2012. Charlottetown (PE): Veterans Affairs Canada, Research Directorate Technical Report; November 2017.
Available at: www.publications.gc.ca
2017 Veteran Suicide Mortality Study (1976 to 2012)
Research Directorate Technical Report
November 30, 2017
Table of Contents
- Executive Summary
- Introduction
- Methods
- Results
- Cohort Summary
- Male Suicide and All-Cause Mortality by Age Group
- Female Suicide and All-Cause Mortality by Age Group
- Comparison of Male and Female Suicide and Mortality
- Male Suicide and All-Cause Mortality Over Time
- Female Suicide and All-Cause Mortality Over Time
- Discussion
- Strengths and Limitations
- Comparisons with Other Countries
- Conclusions
- List of Acronyms
- References
- Appendix A - Cohort Definition
- Appendix B - Data Sources
- Appendix C - Case Definition
- Appendix D - Data Analysis
- Appendix E - Age and sex distribution of the Veteran study cohort 25
- Appendix F - Age-specific and age-adjusted rates
- Appendix G - Male temporal age-adjusted rates and Poisson regression
Executive Summary
Suicide in Canada’s Armed Forces Veteran population is tragic and a top public health concern for Veterans Affairs Canada (VAC). Collaborative efforts by epidemiologists and researchers at VAC, the Department of National Defence (DND) and Statistics Canada (STC) have led to the successful linkage of military career records of over 200,000 former Regular Force and Class C Reservist CAF personnel to Canadian death records. This list of Veterans has been the foundation of the Veteran Suicide Mortality Study (VSMS), which aims to enhance the understanding of factors associated with suicide in CAF Veterans, to provide updates on suicide trends over time, to aid in the discussion of suicide prevention activities, and to respond to the ongoing public expectation for timely reporting.
Administrative data from DND was linked to 37 years of Canadian mortality data at STC. Suicides were identified by cause of death classification from provincial and territorial coroners’ reports and analysed by sex. To account for age and sex distribution differences between the Veteran and Canadian general population (CGP), Standardised Mortality Ratios were calculated to estimate the magnitude of excess risk experienced by Veterans, and age-adjusted rates were calculated to examine trends over time.
The VSMS resulted in three key findings:
- Male Veterans had an overall 1.4 times higher risk of dying by suicide compared to the male CGP, with the youngest males being at highest risk.
- Female Veterans had an overall 1.8 times higher risk of dying by suicide compared to the female CGP, and this was observed in both younger and older Veterans.
- The risk of suicide for both male and female Veterans has generally remained higher than that of the CGP, and relatively unchanged over the past four decades. The annual rates demonstrated large fluctuations but no significant increase over time.
The higher risk of suicide for young male Veterans in Canada was similar to findings in the US, UK, and Australia. Previous VAC studies have also found a higher prevalence of mental health problems among released CAF Regular Force and deployed Reserve Force Veterans, which is of particular concern to VAC given the well-established link between certain mental health diagnoses and increased suicide risk. Findings from this study will be used to inform suicide prevention activities for CAF Veterans, while further analyses will be conducted to investigate factors associated with suicide in the Veteran population.
Introduction
Deaths due to suicide are tragic and have far-reaching impacts on the deceased’s family, friends, co-workers, and the communities to which they are connected. Suicide surveillance and research is a public health priority for Veterans Affairs Canada (VAC), and monitoring and conducting further analysis on Veteran suicides supports ongoing suicide prevention activities.
The Veteran Suicide Mortality Study (VSMS) is a collaborative study between VAC, the Department of National Defence (DND), and Statistics Canada (STC) with the following aims: to enhance the understanding of factors associated with suicide in Canadian Armed Forces (CAF) Veterans, to provide updates on suicide trends over time, to aid in the discussion of suicide prevention activities, and to respond to the ongoing public expectation for timely reporting.
Efforts to study the risk of suicide in the CAF Veteran population have been challenging due to limited data availability, specifically surrounding the identification of Veterans in Canadian health and vital statistics/demographic databases following their release from the CAF. Once military personnel leave the CAF, they receive health care from provincial and territorial health services and not VAC. VAC clients represent an estimated 20% of total CAF Veterans and are not a representative sample of the entire Veteran population, and therefore cannot not be studied on their own to estimate the incidence of suicide ideation, attempts, or suicide mortality in Canada’s CAF Veterans.
To overcome these challenges, VAC has sought the assistance of STC and DND. In Canada, STC links provincial and territorial Vital Statistics Databases which contain official cause of death information, including deaths by suicide. These databases on their own are currently unable to identify current and former CAF personnel. As a result, VAC and DND have worked together to identify a large cohort of serving and released Regular Force and Reserve C Force (deployed) personnel from the DND administrative databases, which was then linked to death records at STC. In 2010, a first attempt to examine still serving and released CAF mortality using these methods was conducted via the Canadian Forces Cancer and Mortality Study (CF CAMS) (STC, 2011). The study found that the risk of suicide among male Veterans was 1.5 times higher than the Canadian General Population (CGP) during the 35-year follow-up period. However, due to data quality limitations this study was unable to determine whether the risk of suicide changed over time and was unable to fully assess the risk of suicide in female Veterans.
In 2017, using improved data and epidemiological methods, DND and VAC repeated the CF CAMS (CF CAMS 2) and VAC used a subset of the linked data to conduct the VSMS. This most recent collaborative data linkage project has allowed VAC to conduct epidemiological studies of the risk of suicide in comparison to the CGP, and examine trends over time. The study findings will help identify high-risk groups and temporal trends, and therefore aid in the development of targeted suicide intervention and prevention programs, and providing baseline data for evaluation of these programs.
This report aims to identify the extent to which suicide mortality affects the Veteran population compared to the CGP, identify specific age groups at risk, and examine any temporal trends from 1976 to 2012.
Methods
The VSMS follows Regular Force and Class C Reservist Veterans who released from the CAF between 1976 and 2012, identified using DND’s Central Computerised Pay System (CCPS) (Appendix A). Given that Reserve “A” and “B” personnel are paid through a different system, Class A and B reservists were unable to be included in this study.
Several data sources were used to create a military occupational and mortality history for each Veteran (Appendix B). The CCPS records, which include information on each Veteran’s occupational and deployment history, were supplemented with data from DND’s Human Resources Management System (HRMS) to create as complete of a military history as possible. Analysts at STC linked the military data to death records in the Canadian Vital Statistics Database (CVSD), which includes information on date and cause of death from the provincial and territorial Vital Statistics databases. The complete linked dataset was anonymised and held in a secure area at STC, where VAC and DND epidemiologists conducted analyses. Aggregate Canadian population and death data by sex, 5-year age group, year, and cause of death were provided by STC for the study reference population. A 37-year study follow-up period was used as the earliest date that Veterans could be identified in the CCPS records was 1976, and STC mortality data were available only up to 2012 at the time of data linkage.
All Veteran deaths were included in the linkage to examine all-cause mortality. Suicide deaths were identified in the death records by the World Health Organisation’s (WHO) International Classification of Diseases (ICD) codes (Appendix C).
As the age and sex distributions of the Veteran cohort and the CGP are quite different, it is misleading to simply compare crude death rates or frequencies between these two populations. As a result, two different analyses were conducted to estimate the risk of suicide and death in the Veteran population, taking into account these differences: Standardised Mortality Ratios (SMR) and age-adjusted rates (Appendix D).
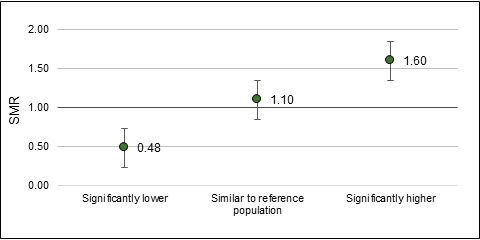
SMRs were calculated using 5-year age groups to compare the risk of suicide in Veterans to the CGP. A value of 1.0 suggests that the risk of death in the Veteran group is the same as the CGP. A value less than 1.0 suggests a lower risk, and a value greater than 1.0 suggests a higher risk. 95% confidence intervals (CI) were also calculated; CIs that overlap 1.0 suggest that the SMR is not statistically significant. SMRs can also be converted into percentages; e.g. an SMR of 1.25 would equate to a 25% higher risk, while an SMR of 0.75 would equate to a 25% lower risk.
Age-specific, annual, and overall age-adjusted suicide rates were calculated for both Veterans and the CGP using 15-year age groups. It should be noted that small numbers of deaths or populations, as observed in this study, can cause the trends to become statistically unstable, and therefore should be interpreted with caution. 95% CIs were also calculated for rates to determine whether rates were statistically different from each other. Linear trend lines were calculated from the age-adjusted rates to compare estimated temporal suicide trends for Veterans and the CGP. Poisson regression was conducted to test whether Veteran rates changed significantly over time, using the same 15-year age groups.
In compliance with STC privacy regulations, all SMRs and rates were collapsed and presented in age or time period categories that ensured minimum cell counts of 10. Where collapsing was not possible (e.g. with annual age-standardised rates), data points were suppressed.
Results
Cohort Summary
The final linked VSMS cohort included 200,734 Canadian Veterans by the end of the study period in 2012, after starting with 9,885 Veterans released in 1976 (Appendix A, Figure A-1). This equated to a total 4,136,494 male and 461,634 female person-years (PY). The Veteran cohort was 89% male, 60% released at a Junior Non-Commissioned Member (NCM) rank, and 26% released since 2000. Some cohort members had a combination of service experience in both the Regular Force and as Class C Reservists during their careers. The majority of the cohort (95%) had been part of the Regular Force at some time in their military careers, and 14% had at least some Class C Reserve service time. Table 1 provides additional details on the cohort’s military characteristics.
See Appendix E for a more detailed description of the age and sex distribution of the VSMS cohort.
Male Suicide and All-Cause Mortality by Age Group
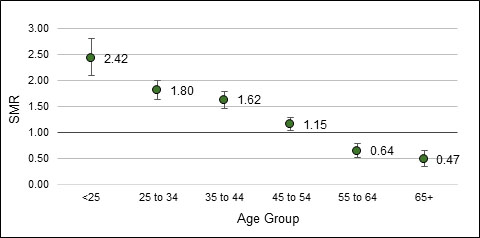
Overall, when adjusted for age distribution differences between the Veteran and Canadian general populations, Veteran males had a 36% higher risk of dying by suicide than the CGP. Male Veterans under 55 years of age were at a significantly higher risk of death by suicide than the CGP, with males under 25 years being at highest risk: 242% higher risk compared to males of the same age in the CGP. In contrast, male Veterans aged 55 to 64 years had a 36% lower risk of suicide, and those aged 65 years and older had a 53% lower risk of suicide compared to the CGP (Table 2, Figure 1). The same trend was reflected in the calculated age-specific and age-adjusted suicide rates (See Appendix F – Table A).
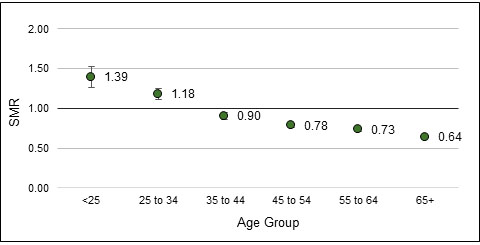
When examining all-cause mortality, Veterans had an overall 27% lower risk of death compared to the CGP males. However, Veterans aged less than 25 years and 25 to 34 years were at a significantly higher risk of death compared to CGP males of the same age, at 39% and 18% higher, respectively (Table 3, Figure 2). These trends were also noted when examining the age-specific and age-adjusted rates (Appendix F – Table B).
Female Suicide and All-Cause Mortality by Age Group
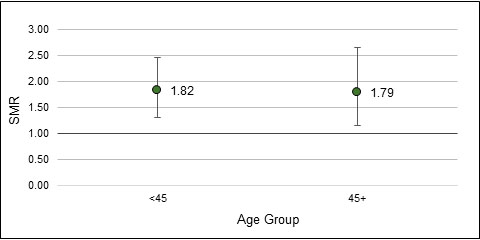
Overall, female Veterans had an 81% higher risk of dying by suicide compared to the female CGP. The small number of female suicides restricted the analysis to two age groups: under 45 years, and 45 years and older. This increased risk of suicide was observed in both female age groups (Table 4, Figure 3). The same trend was noted when examining age-specific and age-adjusted rates (Appendix F – Table C).
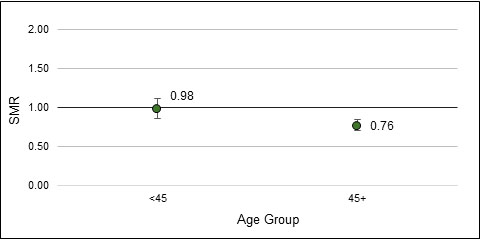
In contrast, for all-cause mortality, female Veterans overall had a 17% lower risk of death than the female CGP. However, the all-cause risk of death for female Veterans under 45 years was not significantly different from females in the general population (Table 5, Figure 4). The same observations were made when examining age-specific and age-adjusted all-cause mortality rates (Appendix F – Table D).
Comparison of Male and Female Suicide and Mortality
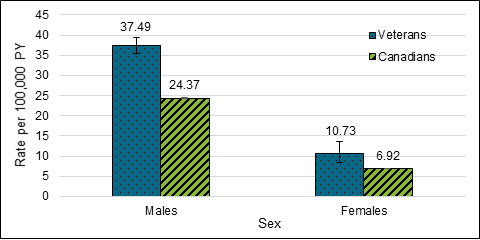
Overall, age-adjusted suicide rates for males and female Veterans were significantly higher than in the CGP. The Veteran male suicide rate was significantly 3.5 times higher than in Veteran females (Figure 5).
-
Figure 5. Age-adjusted suicide rates for Veterans and the CGP, 1976 to 2012.
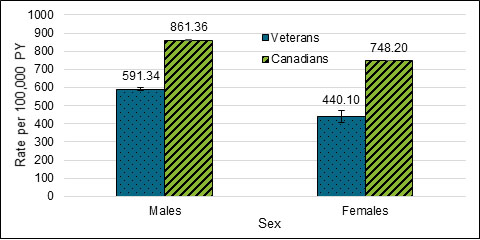
In contrast to suicide rates, the overall all-cause mortality rates for both male and female Veterans were both significantly lower than in the CGP. The Veteran male mortality rate was significantly higher than in Veteran females (Figure 6).
-
Figure 6. Age-adjusted all-cause mortality rates for Veterans and the CGP, 1976 to 2012.
Male Suicide and All-Cause Mortality Over Time
The risk of dying by suicide remained significantly higher than the CGP in all time periods examined, with all estimates demonstrating overlapping confidence intervals (Table 6, Figure 7). From 1976 to 2012, a male Veteran’s risk of dying by suicide compared to the CGP did not change significantly.
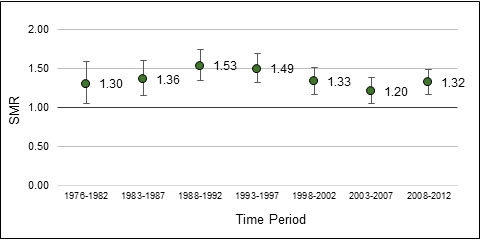
Over the study period, the data revealed large fluctuations of statistically unstable annual rates for male Veterans. To determine if there was a trend obscured by these points, Poisson regression was used to take into account small annual counts, which found there was no statistically significant annual increase in male Veteran suicide rates (p=0.143). See details in Appendix G.
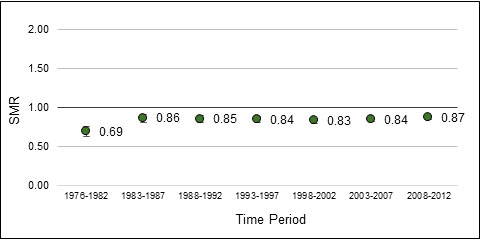
In regards to all-cause mortality, male Veterans had a significantly lower risk of death compared to the CGP for all time periods examined. At its lowest, the risk of death was 31% lower than the CGP from 1976 to 1982, after which it increased slightly and remained stable with no significant changes in risk through to the end of the study period in 2012 (Table 7, Figure 8).
Female Suicide and All-Cause Mortality Over Time
For female Veterans, the risk of dying by suicide remained significantly higher than the female CGP from 1993 to 2012. Although female Veterans had a 74% higher risk of suicide during 1976 to 1992, this was not statistically significant (Table 8, Figure 9).
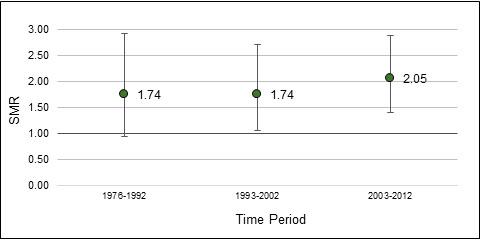
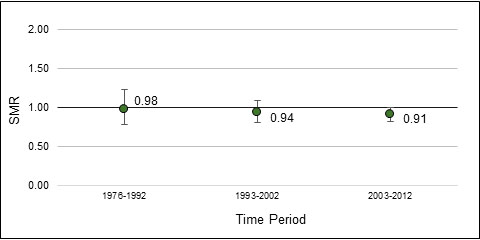
When examining all-cause mortality, females remained at a similar risk of death as the female CGP across all time periods from 1976 to 2012 (Table 9, Figure 10).
Annual age-adjusted suicide and all-cause mortality rates for female Veterans are unavailable due to an insufficient number of years that meet minimum death count publication requirements by STC, and therefore insufficient data to examine annual trends.
Discussion
Suicide is a critical public health concern for VAC. With assistance from DND and STC, VAC has been able to successfully obtain and analyse the largest dataset of CAF Veterans cause of death and military service to date. The key findings from this report are the following:
- Suicide risk and rates are significantly higher in Veteran males compared to the male CGP. Veteran males in the youngest age groups are at highest risk of suicide.
- For female Veterans, suicide risk and rates are significantly higher compared to the CGP. Both younger and older female Veterans appear to be at a similar risk.
- The risk of suicide for both male and female Veterans has generally remained higher than that of the CGP, and relatively unchanged over the past four decades. The annual rates demonstrated large fluctuations but no significant increase over time.
Both SMRs and age-adjusted rates revealed Veterans’ increased risk of suicide. Overall, the age-adjusted suicide rate for male Veterans was 37 per 100,000 person-years; this is a 40% higher risk of death by suicide compared to the CGP. For female Veterans, the age-adjusted suicide rate was 11 per 100,000 person-years; this is an 80% higher risk of death by suicide compared to the female CGP. Similar to what has been observed in the general population (Health Canada, 1994; Navaneelan, 2016), the VSMS found that male Veterans had a 3.5 times higher rate of suicide than female Veterans. Female Veterans had an SMR of 1.8, while male Veterans had an SMR of 1.4; however, these male and female suicide SMRs cannot be directly compared as they use two different reference populations (the male CGP and female CGP).
For males, the risk of suicide was highest in the youngest Veterans. For example, 174 of the total 435 deaths in Veterans under 25 years (40%) were due to suicide, resulting in a 2.4 times higher risk of suicide compared to the male CGP. Male Veterans in the 25 to 34 years and 35 to 44 years age groups were also at a significantly higher risk of suicide. Veteran males aged 45 to 54 were at a slightly higher risk than the CGP, but this bordered on statistical significance. This finding highlights the need to further examine factors associated with becoming a young Veteran, such as early release from the military. It was also observed that male Veterans under 35 years of age had a significantly higher risk of death due to all causes compared to the male CGP; however, the opposite was observed in males aged 35 years and older. This higher risk of death by any cause in younger male Veterans may be in part due to the higher proportion of deaths being due to suicide. It would be worthwhile to examine what causes of death are contributing to this trend in young male Veterans as part of the CF CAMS 2. Lastly, when examining trends over the 37-year time period, there were no significant changes in male Veteran suicide risk, although the risk of suicide remained significantly higher than in the CGP.
Due to small numbers, we were unable to examine female Veterans’ risk at the same level of age granularity as for males. Both female Veterans under 45 years and 45 years and older were at approximately the same risk of suicide, at an 82% higher risk and 79% higher risk, respectively. Although the female Veteran suicide rate is lower than that of male Veterans, the female patterns have not improved relative to those reported in CF CAMS (STC, 2011). The increased female Veteran suicide risk is not restricted to VAC. For example, in the period between 2000 and 2010, the US Department of Veterans Affairs observed a 40% increase in suicide amongst female Veterans (Hoffmire et al., 2015). The underlying risk factors and/or method of suicide may be different between females and males (McGirr et al., 2006; Callaghan et al., 2012). In addition, this elevated female Veteran suicide risk needs to be evaluated in conjunction with the understanding that females are far more likely to attempt suicide than males (Kessler et al., 1999), but do so using less lethal means (Hawton, 2000). Because of this, the higher risk of suicide in female Veterans is likely correlated with a corresponding higher risk in undetected suicide attempts. This provides strong evidence to support prevention and treatment efforts tailored specifically to females.
Strengths and Limitations
One of the key strengths of this study lies in its data sources. Studies aiming to measure the risk of a rare health event, such as suicide, are challenging to conduct because in order to gather any statistically significant findings, extremely large sample sizes are required. To achieve this, VAC built a cohort of over 200,000 CAF personnel who left the military as early as 1976, a task that would be nearly impossible to carry out surveying Veterans and their families. In addition to the advantage of having a large population to study, the VSMS’s strength lies in its use of comprehensive administrative datasets, which avoids the issue of recall bias observed in conducting surveys. One of the administrative datasets used to build military career history, DND’s CCPS, is based on pay data and therefore has a built-in feedback mechanism, whereby both personnel and the employer are motivated to correct pay errors as soon as possible. In addition, the death records were derived from official coroner’s data, ensuring Veterans’ deaths are equally likely to be reported as suicides as the CGP.
There were also several limitations in both the administrative pay and human resources data from DND, and the mortality data from STC. It was observed that DND`s data occasionally contained errors, which were corrected where possible, and that some variables contained a significant amount of missing data; although this was not the case for the variables examined for this iteration of the study (i.e. age, sex, release dates), it could prove challenging in future analyses examining military service history and possible exposures. This serves as a reminder that in general, administrative data are not collected with the intention to be used in epidemiological studies, and therefore must be interpreted with this in mind. STC`s mortality data was also subject to data errors and possible reporting bias. In Canada, all unexpected, unexplained violent deaths are investigated by a coroner or medical examiner under provincial/territorial mandate. Classifying cause of death can be challenging as determining intent can be subjective and complex and nature. For example, a recent Canadian study of intentional and unintentional deaths by poisoning revealed that misclassification of deaths as suicide or accidental may be an issue (Skinner et al., 2016). Secondly, although the mortality records provided were overall complete, STC`s CVSD does not routinely capture out-of-country deaths. As a result, it is possible that Veterans in the cohort died abroad and their deaths were never reported back to STC. Although we are also missing out-of-country death records for the CGP, what remains unknown is whether Veterans are more likely to die abroad than the CGP.
Although the VSMS gained its statistical power thanks to the large administrative datasets, there are several limitations to the study that must be taken into consideration when interpreting the findings. As is a struggle with many military health studies, there was a lack of an optimal comparison group. The Veteran population and CGP differ in more than ways than only sex, age, and military exposures and experiences; data on other possible variables associated with risk of suicide, such as race, sexual orientation, marital status, employment, income, education, and underlying physical and mental health conditions (Health Canada, 1994; Thompson et al., 2016), were not available for this study and therefore could not be controlled for when comparing mortality risks.
This study captures a large number of Veterans; however the cohort started with small numbers of Veterans who released in the early years of the study. Sensitivity analyses conducted prior to the VSMS found little difference in versions of the cohort that included and excluded pre-1976 enrollees, and therefore it was decided to include the pre-1976 enrollees to create a larger study population and maximize the study power.
Another limitation of this study is that Veterans of Reserve Classes A and B were not included in the military cohort. These excluded Veterans have similar characteristics as the CGP, including similar rates of depression, anxiety, activity limitations, social support, and satisfaction with life. This suggests that they were appropriately included in the CGP (VanTil et al., 2016).
VAC and DND recognize the complex multi-factorial nature of suicidality (CAF-VAC, 2017). Although we have a fairly complete picture of Veterans’ military careers from DND’s administrative databases, data were not available on Veterans’ personal life stressors and experiences prior to their deaths. DND’s Medical Professional Technical Suicide Review (MPTSR), which investigates suicides in serving CAF personnel, observed that 92.9% of CAF personnel who died by suicide in 2015 had at least one work and/or life stressor, including failing relationships, friend/family suicide or death, family and/or personal illness, debt, professional problems, and legal problems (Rolland-Harris et al., 2016). The lifecourse of a military member supports the presumption that some, if not all, of the risk factors identified during military service continue to be relevant post-release. Unfortunately, with the absence of these types of detailed suicide investigation reports for Veterans, we were not able to confirm this. Data on life stressors could have allowed insight into suicide risk and paint a more complete picture of the circumstances surrounding these Veterans’ suicides. As a result, there remains a knowledge gap on what occurred to these individuals during the time between when they left the military and when they died.
In terms of the broader context of suicidality (ideation, attempts and suicide death), it should be noted that the study data captured only deaths by suicide. A recent study found that an estimated 3.2% of suicide attempts in American adults are fatal (Han et al., 2016), while similarly, the WHO estimates that approximately 5% of suicide attempts worldwide are fatal (WHO, 2014). VAC’s Life After Service Studies (LASS) have consistently found a higher prevalence of mental and physical health problems among released CAF Regular Force and deployed Reserve Force Veterans (Thompson et al., 2016; VanTil et al., 2016; VanTil et al., 2017), which is of particular concern to VAC given the well-established link between certain mental health diagnoses and increased suicide risk (Hirschfeld and Russell, 1997). In addition, 6% of CAF Regular Force Veterans released in 1998-2009 had past-year suicidal ideation and 1% had past-year suicide attempts (Thompson et al., 2014). LASS findings on the extent and correlates of suicidal ideation and attempts in CAF Veterans may be used to help inform further analyses of the suicide data.
Comparisons with Other Countries
Studies looking at Veteran suicide in other countries have seen similar findings to those found in the VSMS, especially when looking at the younger age groups. In Australia, it was observed that Veteran males under 25 years were 2 times more likely to die by suicide, and those aged 25 to 29 years were 1.4 times more likely to die by suicide compared to Australian men of the same age (Australian Institute of Health and Welfare, 2017). In the UK, Kapur et al. (2009) found that males under 25 years who left the Armed Forces were at a 2-3 times higher risk of death by suicide compared to the serving and general populations. A study of US Veterans observed that in 2010, male Veterans were 1.5 times and female Veterans 5.9 times more likely to die by suicide than expected (Hoffmire et al, 2015). In contrast, however, a study of Scottish Veterans found that male Veterans did not have a significantly different risk of suicide compared to male non-Veterans, although there was evidence that female Veterans were at increased risk compared to non-Veteran females (Bergman et al., 2017). In addition, the finding of young male Veterans being at highest risk of suicide contrasts with the CGP peak in suicide rate during mid-life (Navaneelan, 2016). The increased risk in younger male Veterans remains unexplained.
Conclusions
Suicide among Canadian Veterans has received considerable attention as a tragic end to lives that included military service. Efforts to study suicide in the Veteran population have been hindered by a lack of an identifier in Canadian Vital Statistics records to flag individuals who have served in the CAF. However, collaborative efforts by epidemiologists and researchers at VAC, DND and STC have led to the successful linkage of military career records of over 200,000 former CAF personnel to Canadian death records over 37 years. Although Veterans have an overall lower risk of all-cause mortality, Canadian Veterans are at a significantly higher risk of death by suicide compared to Canadians in the general population with no prior military service. At particular risk are the youngest male Veterans, as well as female Veterans overall. Although the risk of suicide in the Veteran population has remained consistently higher than in the CGP since 1976, the small increase in the age-adjusted rate was not statistically significant. However, the rate of suicide in the CGP has been decreasing steadily overall, reinforcing that suicide can be prevented. Findings from this study will be used to inform suicide prevention activities for CAF Veterans, while further analyses will be conducted to investigate risk indicators associated with suicide in the Veteran population.
List of Acronyms
References
Australian Institute of Health and Welfare. (2017). Incidence of suicide among serving and ex-serving Australian Defence Force personnel 2001–2015: in brief summary report. Cat. no. PHE 213. Canberra: AIHW.
Bergman, B.P., Mackay, D.F., Smith, D.J., Pell, J.P. (2017). Suicide in Scottish military veterans: a 30-year retrospective cohort study. Occup Med. doi:10.1093/occmed/kqx047
CAF-VAC. (2017). Canadian Armed Forces and Veterans Affairs Canada Joint Suicide Prevention Strategy. Ottawa, ON: Canadian Armed Forces and Veterans Affairs Canada. Available online at https://www.canada.ca/content/dam/dnd-mdn/documents/reports/2017/caf-vac-joint-suicide-prevention-strategy.pdf
Hawton, K. (2000). Editorials: Sex and suicide: Gender differences in suicidal behaviour. The British Journal of Psychiatry. 177(6):484-485.
Health Canada. (1994). Suicide in Canada: Update of the report of the task force on suicide in Canada.
Hirschfeld, R.M.A., Russell, J.M. (1997). Assessment and treatment of suicidal patients. N Engl J Med. 337:910-915.
Hoffmire, C.A., Kemp, J.E, Bossarte, R.M. (2015) Changes in suicide mortality for Veterans and nonveterans by gender and history of VHA service use, 2000-2010. Psychiatric Services. 66(9):959-965.
Kapur, N., While, D., Blatchley, N., Bray, I., Harrison, K. (2009). Suicide after leaving the UK Armed Forces – a cohort study. PLoS Med. 6(3): e1000026
Kessler, R.C., Borges, G., Walters, E.E. (1999). Prevalence of and risk factors for lifetime suicide attempts in the National Comorbidity Survey. Archives of General Psychiatry. 56(7): 617-626.
Navaneelan, T. (2016). Suicide rates: an overview. Health at a Glance, Statistics Canada. Available online at https://www.statcan.gc.ca/pub/82-624-x/2012001/article/11696-eng.htm
Rolland-Harris, E., Weeks, M., Simkus, K., VanTil, L. Overall mortality of Canadian Armed Forces personnel enrolled 1976-2012. Occ Med. In Press.
Rolland-Harris, E, Cyr, E., Zamorski, M.A. (2016) Report on Suicide Mortality in the Canadian Armed Forces (1995 to 2015). Surgeon General Report. Department of National Defence.
Rolland-Harris E, VanTil L, Zamorski M, Boulos D, Reicker A, Trudeau R, Masoud H, Weeks M, Simkus K: The Canadian Forces Cancer and Mortality Study II: A Longitudinal Record-Linkage Study Protocol. CMAJ Open submitted.
Skinner, R., McFaull, S., Rhodes, A.E., Bowes, M., Rockett, I.R.H. (2016). Suicide in Canada: Is poisoning misclassification an issue? The Canadian Journal of Psychiatry. 61(7):405-412.
Statistics Canada. (2011). Canadian Forces Cancer and Mortality Study: Causes of Death. In: Statistics Canada, ed. Ottawa: Minister of Industry.
Thompson, J.M., VanTil, L., Zamorski, M.A., Garber, B., Dursun, S., Fikretoglu, D., Ross, D., Richardson, J.D., Sareen, J., Sudom, K., Courchesne, C., Pedlar, D. (2016). Mental health of Canadian Armed Forces Veterans – Review of Population Studies. JMVHR. 2(1):70-86.
Thompson J.M., Zamorski, M.A., Sweet, J., VanTil, L.D., Sareen, J., Pietrzak, R.H., Hopman, W.H., MacLean, M.B., Pedlar, D.J. (2014). Roles of physical and mental health in suicidal ideation in Canadian Armed Forces Regular Force veterans. Can J Public Health. 105(2):e109-e115.
Van Til L,D., Sweet, J., Poirier, A., McKinnon, K., Sudom, K., Dursun, S., Pedlar, D. (2017). Well-Being of Canadian Regular Force Veterans, Findings from LASS 2016 Survey. Charlottetown PE: Veterans Affairs Canada. Research Directorate Technical Report, 23 June 2017. Available online at http://publications.gc.ca/pub?id=9.839366&sl=0
VanTil, L., MacLean, M.B., Poirier, A., McKinnon, K., Keough, J., Sudom, K., Dursun, S., Herron, M., Pedlar, D. (2016). Veterans of the Reserve Force: Life After Service Studies 2013. Veterans Affairs Canada, Research Directorate Technical Report (21). 25 October 2016. Available online at http://publications.gc.ca/pub?id=9.826344&sl=0
World Health Organisation. (2014). Preventing suicide: A global imperative. WHO. Geneva, Switzerland.
Appendix A - Cohort Definition
The VSMS follows CAF Regular Force and Class C Reservist Veterans who released from the CAF between January 1, 1976 and December 31, 2012. The cohort was defined using pay data from DND’s Central Computerised Pay System (CCPS) and death records from Statistics Canada’s Canadian Vital Statistics Database (CVSD) under the following inclusion criteria:
- cohort members must have released from the CAF on or after 1976;
- cohort members must no longer be serving as of December 31, 2012, and must be surviving upon their release (i.e. did not die in service); and
- their age at enrolment/release and dates of death must be logical relative to their service time.
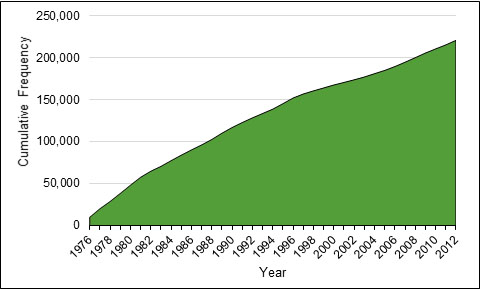
The cohort grew from 9,885 Veterans in 1976 to a total 220,734 Veterans by 2012 (Figure A-1). This does not exclude Veterans who died during this period, although Veterans were removed from the study population as they died to calculate SMRs and rates.
For more information, please contact VAC.Research-Recherche.ACC@vac-acc.gc.ca.
Given that Reserve “A” and “B” personnel are paid through a different system, this precludes the inclusion of Class A and B reservists from this study.
Where possible, data were cleaned, and where corrections could not be made, exclusion criteria were applied. This included setting 16 years as a minimum age at enrolment and release, and 60 years as a maximum age of enrolment. Any personnel who had a death record and died within 14 days after release were considered “in-service deaths” instead of Veteran deaths due to the more likely possibility of the release date being entered incorrectly; this was supported based on the number of suicides within 14 days of release aligning with the known number of in-service suicide deaths from previous DND studies. In addition, any CAF personnel who had “deceased” as their reason for release were excluded from the cohort, whether or not they had a death record in the linked cohort. In all cases, these data quality exclusions were relatively rare and it would be unlikely that their exclusion from the cohort would affect the results (Figure A-2). The final cohort file contained the military career history of 220,734 unique individuals.
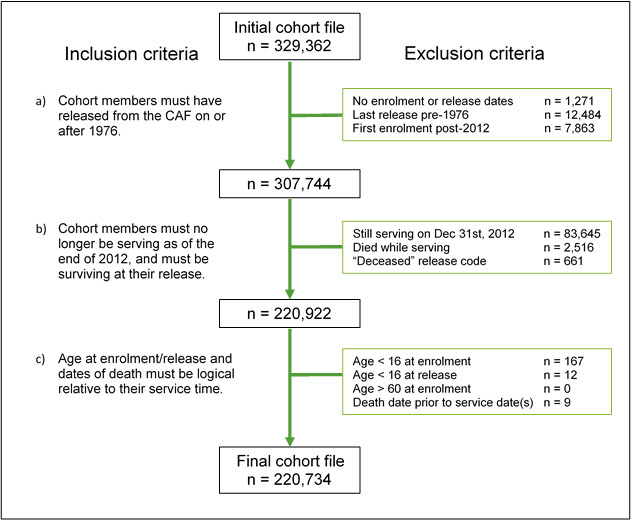
-
Figure A-2. Flow chart showing the inclusion and exclusion criteria used to create the VSMS cohort.
Appendix B - Data Sources
The Central Computerised Pay System (CCPS) is an electronic DND dataset which identifies all Regular Force and Class C Reservists (those reservists who participated in international operations and/or tours of duty) who enrolled and/or released from the CAF dating back to 1976. CCPS was chosen to create the cohort as it has an accuracy and precision advantage from its built-in feedback mechanism, whereby both personnel and the employer are motivated to correct pay errors as soon as possible. Salaries and pay amounts were not shared with the research team; only start and end dates of pay were used to identify when each service member ended their employment with the CAF (“released”), in addition to the start and end dates for any extra deployment-associated pay they would have received when overseas.
The Human Resources Management System (HRMS) is a second DND administrative dataset that contains historical and current demographic and occupational data on serving CAF personnel. The cohort file defined using CCPS was supplemented and validated using data from HRMS. This aided to reduce the amount of missing information and resolving incorrect information.
The Canadian Vital Statistics Database (CVSD) provides mortality information from 1950 onwards to the latest available year of data, which at the time of data linkage for the VSMS, was 2012. Information from the CVSD is provided by the ICD code in effect at the time of death. Cause of death information is recorded by Vital Statistics Registries in the provinces and territories. The mortality variables used in the VSMS are full date of death, and underlying cause of death (ICD code).
The CAF personnel data from DND were deterministically linked by STC to the CVSD based primarily on Social Insurance Number. The anonymised linked data were held in a secure area within STC and were accessible only to designated researchers at DND and VAC. Further details on the data and linkage methodology is published under the CF CAMS 2 protocol, which uses the same linked data as the VSMS (Rolland-Harris et al., CMAJ Open submitted).
Aggregate Canadian population data and death data was provided by STC in the form of historical reports, spreadsheets, and CANSIM tables available publicly online. Population counts and death counts were provided by sex, 5-year age groups, year, and ICD-8, -9, or -10 codes for cause of death.
Appendix C - Case Definition
Suicide deaths were reported using three different versions of the WHO’s International Classification of Diseases (ICD) throughout the 37-year study: for ICD versions 8 (years 1976 to 1978) and 9 (years 1979 to 1999), codes E950-E959 were used; for ICD version 10 (years 2000 to 2012), codes X60-X84 and Y87.0 were used. This case definition is consistent with that used by both DND and STC when studying suicide (Rolland-Harris, 2016; Navaneelan, 2016).
In addition to suicide, all-cause mortality was also examined. Other specific or chapter-level causes of death in Veterans were not examined under the scope of the VSMS, although these topics are covered under DND’s Canadian Forces Cancer and Mortality Study 2 (CF CAMS 2) (Rolland-Harris et al., In Press; Rolland-Harris et al., CMAH Open Submitted).
Appendix D – Data Analysis
Privacy Regulations
In compliance with the requirements of the Statistics Act, all counts of deaths fewer than 10 are required to be suppressed. Therefore, where required, age groups or time periods were collapsed to ensure death counts were greater than or equal to 10. Where it was not possible to collapse subgroups, counts or rates were suppressed.
Cohort Description
A summary was prepared to describe the age and sex distribution of the Veteran cohort by sex, age at study end, age at death, component, rank, era of enrolment, and era of release. Eras of enrolment and release were defined based on a combination of changes in periods in military peacekeeping operations and approximate division of the study period into three decades.
Standardised Mortality Ratios
Standardised Mortality Ratios (SMR) were used to compare the rate of suicide of the VSMS cohort with that of the CGP. Suicide rates were calculated separately for males and females, each time period of follow-up, and each age group in the VSMS cohort and compared with the corresponding group in the general population using indirect standardisation methods.
An SMR value of 1.0 indicates that the observed mortality in the Veteran cohort was the same as that observed in the CGP. Values less than 1.0 suggest lower mortality in the Veteran cohort while values greater than 1.0 suggest higher than expected mortality in the Veteran cohort. In addition to the point estimate, 95% confidence intervals (CI) were calculated, which are valuable in illustrating the expected random variability that is possible when dealing with small numbers of cases. Calculation of CIs used either normal approximation (death counts ≥ 100) or the exact Poisson method (death counts < 100). SMR CIs that overlap 1.0 are not statistically significant. See Figure D for a visual example of interpreting SMRs and their CIs.
Age-adjusted rates
Age-adjusted suicide and all-cause mortality rates for both Veterans and the CGP were calculated using direct standardisation with the 1991 CGP of Canadians aged 15 and older as a reference for examining temporal trends.
When calculating age-adjusted rates, small numbers can cause the trends to become unstable. Overall age-adjusted rates are presented for the 1976 to 2012 study period. In addition, annual age-adjusted rates are presented in this report; however, it should be noted that small numbers of deaths (the numerator) and/or small populations (the denominators) can lead to statistically unstable rates. For rates, 95% CIs were calculated using either normal approximation (death counts ≥ 100) or the exact Poisson method (deaths counts < 100). Linear trends were generated and used to estimate temporal suicide trends for Veterans and the CGP.
The use of SMRs over rates:
When studying mortality (or suicide) rates in a population of interest, such as Veterans, it is critical that the rates be compared to a reference population (in this study, the CGP), and are not interpreted on their own. A rate on its own cannot give any indication of how better off or worse off the population of interest is (i.e. risk) compared to the reference population, or what is expected as baseline had the population of interest and reference population had the same life exposures.
This is why SMRs are the preferred method to examine mortality: they are estimates of the excess risk in the population of interest. In this study, the aim is to estimate any excess risk of mortality or suicide that could be attributable to military service. Although there are many other possible sociological, biological, and environmental exposures other than military service that may be correlated with suicide, those exposure histories are not currently available in the Veteran cohort and/or CGP data. However, this investigation into excess risk of death provides a starting point to generate hypotheses, and to target the allocation of public health resources.
With this in mind, the subpopulation with the highest rate does not always reflect the greatest excess risk; focusing on rates in the absence of contextual interpretation in the form of SMRs may result in resources not being allocated to the group with the most important excess risk. By focusing on the populations for whom there are substantial excess risks, and for whom many of the risks may be modifiable, the more likely an intervention is to be successful.
Software
All data cleaning, manipulation, and analysis activities were conducted using Stata 14 and Microsoft Excel. Data linkage activities were conducted using SAS 9.3.
Appendix E – Age and sex distribution of the Veteran study cohort
Appendix F – Age-specific and age-adjusted rates
Appendix G – Male temporal age-adjusted rates and Poisson regression
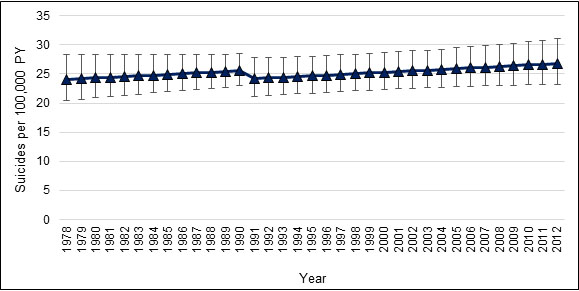
From 1978 to 2012, the age-adjusted rate trend line revealed an overall 9.80% increase in the male Veteran suicide rate, while the male CGP suicide rate decreased by 29.22% from 1976 to 2012 (Figure G-1). (Note: suicide rates for 1976 and 1977 have been suppressed due to counts under 10. See Privacy Regulations under Appendix D.) In addition, for most years, the differences between annual age-adjusted Veteran suicide rates and CGP suicide rates were not statistically significantly different. The annual age-adjusted rates are statistically unstable due to small numbers of deaths and/or numbers of Veterans in individual age groups. In addition, the 95% confidence intervals for these annual rates are large. Therefore the trend should be examined as a whole, and not based on individual years.
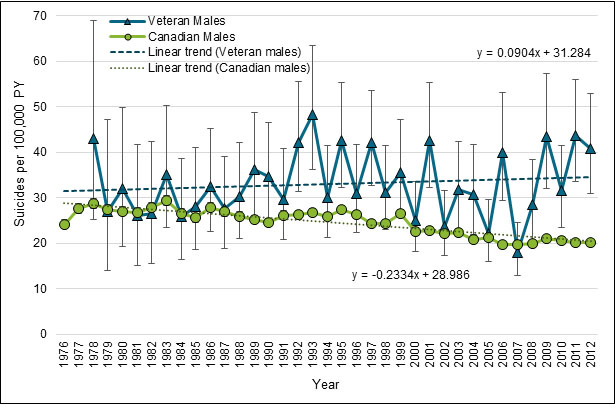
† Age-standardised to the 1991 CGP, collapsed to 15-year age groups.
For more information, please contact VAC.Research-Recherche.ACC@vac-acc.gc.ca.
The Poisson regression model estimated that the adjusted suicide rate increased slightly from 1978 to 2012; however, this change was not statistically significant (p=0.143) (Figure G-2). Goodness-of-fit tests confirmed that the male Veteran suicide data fit the model (Deviance goodness-of-fit = 174.56, p > chi2(156) = 0.1470; Pearson goodness-of-fit = 162.33, p > chi2(156) = 0.3478).
† Collapsed to 15-year age groups.
For more information, please contact VAC.Research-Recherche.ACC@vac-acc.gc.ca.