
At a glance
This departmental results report details our actual accomplishments against the plans, priorities and expected results outlined in our 2024–25 Departmental Plan.
- VAC’s vision, mission, raison d’être, and operating context and key risks
- The Veterans Ombud’s mandate
Key priorities
We delivered on the following key priorities for 2024–25:
- Drive service excellence
Deliver exemplary and timely programs and services, including commemoration, that support the well-being of our Veterans and their families. - Enable modernized and digitized service delivery
Leverage advanced technologies and digital tools to enhance the efficiency and effectiveness of our service delivery, including our commemoration activities. - Provide equitable and accessible programs and services
Provide equitable, accessible, and transparent programs and services tailored to each Veteran’s unique needs, including acts of recognition. - Build an agile and resilient organization
Invest in our organization, ensuring clarity on values and strategic direction while fostering an agile, diverse, and highly skilled workforce and a culture of continuous improvement and innovation.
Our highlights in 2024–25
- Total actual spending (including internal services): $7,630,043,185
- Total full-time equivalent staff (including internal services): 3,770.8
For complete information on our total spending and human resources, read the Spending and human resources section of our full departmental results report.
Summary of results
The following provides a summary of the results we achieved in 2024–25 under our main areas of activity, called “core responsibilities.”
Core responsibility 1: Benefits, Services and Support
Actual spending: $7,425,077,871
Actual full-time equivalent staff: 2,744.3
In 2024–25, we made meaningful progress in helping Veterans and their families achieve physical, mental, social, and financial wellness. We improved access to benefits and services by making more disability benefit decisions, streamlining application processes, and modernizing our tools and technology. Most Veterans reported satisfaction with the support they received, and we continue to make changes based on their feedback. We also expanded access to health care providers, strengthened mental health services, and supported research on chronic pain, brain injuries, and the experiences of women Veterans. Culturally safe supports for Indigenous Veterans were enhanced, and our presence in Northern communities increased.
To support financial stability, we clarified policies intended to help low-income Veterans return to work, expanded financial literacy efforts, and provided urgent assistance to those in crisis. We launched Canada’s first National Veterans Employment Strategy, supported hiring in the federal public service, and connected Veterans with employers through outreach and events. Over 2,100 Veterans used our Career Transition Services, with strong results in job placements, education, and satisfaction.
We improved transition and rehabilitation services by reviewing existing processes, testing new tools, building personalized plans, and securely sharing information. These efforts help Veterans and their families navigate life after service with confidence. We also strengthened housing and long-term care supports by expanding efforts to prevent and reduce Veteran homelessness, launching a national pilot to improve home adaptations, and continuing to fund long-term care services.
Finally, we expanded access to mental health and peer support services, promoted resources for those affected by military sexual trauma, and funded community-based programs to help Veterans feel supported and included. Together, these efforts reflect our commitment to delivering faster, fairer, and more personalized service—and ensuring Veterans and their families get the care, support, and opportunities they deserve.
For more information on Benefits, Services and Support read the ‘Results – what we achieved” section of our departmental results report.
Core responsibility 2: Commemoration
Actual spending: $57,826,517
Actual full-time equivalent staff: 87.2
In 2024–25, we honoured Veterans and all those who served Canada through ceremonies, commemorative events, and educational initiatives. Working with domestic and international partners, we marked significant anniversaries such as D-Day, the Italian Campaign, and peacekeeping missions in Cyprus and Rwanda, helping ensure these moments of service and sacrifice were remembered. We supported the 2025 Invictus Games, where Veterans and military members competed, connected, and inspired communities across Canada.
We shared stories, developed learning tools, and used digital platforms to help Canadians of all ages understand and appreciate the contributions of those who served. Our remembrance efforts included Indigenous voices, underrepresented groups, and youth, helping to build a more inclusive and enduring culture of recognition.
We also focused on preserving Canada’s overseas memorials by repairing monuments, upgrading visitor centres, and improving safety and accessibility. To ensure these sacred sites remain welcoming and sustainable, we planted thousands of trees, modernized infrastructure, and adopted greener technologies. These efforts help honour the legacy of service while protecting these spaces for future generations.
For more information on Commemoration read the ‘Results – what we achieved” section of our departmental results report.
Core responsibility 3 : Veterans Ombudsperson
Actual spending: $4,559,287
Actual full-time equivalent staff: 33.3
In 2024–25, the Office of the Veterans Ombudsperson (OVO) continued to strengthen its ability to deliver timely, fair, and accessible complaint resolution services to Veterans and their families. The Office focused on improving internal processes, enhancing service quality, and expanding outreach and engagement to better meet the needs of those it serves.
The OVO also advanced its mandate to identify and address systemic fairness issues within the Veterans Affairs Portfolio. It published key systemic reports, improved its recommendation tracking process, and enhanced its capacity to detect emerging trends related to fairness. These efforts help ensure that Veterans and their families are treated equitably and that the systems designed to support them continue to evolve and improve.
For more information on Veterans Ombudsperson read the ‘Results – what we achieved” section of our departmental results report.
From the Minister

The Honourable Jill McKnight, P.C., M.P.
Minister of Veterans Affairs and Associate Minister of National Defence
As Canada’s new Minister of Veterans Affairs and Associate Minister of National Defence, I am incredibly proud to serve Canada’s Veterans and their families. This 2024–25 Departmental Results Report highlights how Veterans Affairs Canada (VAC) has been delivering on its mandate to support the well-being of former members of the Canadian Armed Forces (CAF) and Royal Canadian Mounted Police (RCMP), and to recognize and commemorate their achievements and sacrifices.
Our highest priority remains ensuring Veterans get timely service when they ask for support. We are taking action to speed up decisions, including a long-term staffing plan, automating tools, and modernizing our services.
Over 90 percent of the departmental budget in 2024–25 went directly to Veterans, their families, and other program recipients. Among our most noteworthy accomplishments:
- We dedicated over $2.1 million from the Veteran and Family Well-being Fund to three new research projects on women Veterans and brain injuries.
- We approved 1,069 applications through the Veterans Emergency Fund to support Veterans and their families facing sudden financial crises affecting their health and well-being.
- In June 2024, we launched the first National Veterans Employment Strategy to help Veterans find meaningful careers. About 90 percent of the action items in the Strategy have been started, with half of them on track to be completed within their first year.
- We assisted over 2,100 Veterans through our Career Transition Services. About 88 percent achieved at least one successful outcome, nearly 78 percent found jobs, and almost 18 percent returned to school or training.
- And as of March 2025, we were supporting 15,618 clients through our Case Management services, and were providing direct support to 253 Veteran clients who were experiencing or at risk of homelessness.
The past fiscal year also saw us join partners in Canada and around the world to mark key anniversaries and events, including the Italian Campaign, peacekeeping missions in Cyprus and Rwanda, the 80th anniversary of D-Day and the Battle of Normandy, and the 2025 Invictus Games.
As well, we have done significant work to create inclusive spaces that reflect and honour the diversity of Canada’s Veteran community. In April 2024, we proudly led the first-ever delegation of 2SLGBTQI+ Veterans to France and Belgium, where they learned about 2SLGBTQI+ soldiers who served in the First World War.
In advance of Veterans’ Week in November 2024, we distributed 2.8 million learning products to support teachers during this special time of year. Finally, in February 2025 we delivered more than 20,000 cards to Veterans across the country through our successful Valentines for Vets program.
Looking ahead, there is more for us to do to ensure that Canada’s Veterans and families are well-supported through transition and post-service life, and well-recognized for their service to Canadians.
As Minister, it is my privilege to lead the way.
With gratitude to all who have served and those who support them,
The Honourable Jill McKnight, P.C., M.P.
Minister of Veterans Affairs and
Associate Minister of National Defence
Results – what we achieved
Core responsibilities and internal services:
Core responsibility 1: Benefits, Services and Support
Description
Support the care and well-being of Veterans and their dependents or survivors through a range of benefits, services, research, partnerships, and advocacy.
Quality of Life Impacts
The work we did to fulfill this core responsibility may have had a positive impact on the following Quality of life (QoL) domains and indicators:
- Health: Self-rated mental health, Self-rated health
- Prosperity: Financial well-being, Employment, Housing needs
- Society: Sense of belonging to local community
- Life satisfaction
Progress on results
This section details our performance against our targets for each departmental result under Core responsibility 1: Benefits, Services and Support.
Table 1: Veterans are physically and mentally well
Table 1 shows the target, the date to achieve the target and the actual result for each indicator under “Veterans are physically and mentally well” in the last three fiscal years.
Table 2: Veterans and their families are financially secure
Table 2 shows the target, the date to achieve the target and the actual result for each indicator under “Veterans and their families are financially secure” in the last three fiscal years.
Table 3: Veterans have a sense of purpose
Table 3 shows the target, the date to achieve the target and the actual result for each indicator under “Veterans have a sense of purpose” in the last three fiscal years.
Table 4: Veterans are able to adapt, manage, and cope within post-service life
Table 4 shows the target, the date to achieve the target and the actual result for each indicator under “Veterans are able to adapt, manage, and cope within post-service life” in the last three fiscal years.
Table 5: Veterans are living in safe and adequate housing
Table 5 shows the target, the date to achieve the target and the actual result for each indicator under “Veterans are living in safe and adequate housing” in the last three fiscal years.
Table 6: Veterans are socially supported
Table 6 shows the target, the date to achieve the target and the actual result for each indicator under “Veterans are socially supported” in the last three fiscal years.
Table 7: Veterans are satisfied with the services they receive
Table 7 shows the target, the date to achieve the target and the actual result for each indicator under “Veterans are satisfied with the services they receive” in the last three fiscal years.
The Results section of our Infographic on GC Infobase provides additional information on our results and performance related to our program inventory.
Details on results
The following section describes our results for Benefits, Services and Support in 2024–25 compared with the planned results set out in our departmental plan for the year.
Departmental Result: Veterans are physically and mentally well
Results achieved
In 2024–25, we made more Disability Benefits decisions, expanded access to health care providers, and improved mental health services. We supported research on women Veterans, chronic pain, and brain injuries, and worked to close gaps in service delivery. We also strengthened culturally safe supports for Indigenous Veterans, increased our presence in Northern communities, and helped more Veterans stay independent at home. These efforts help ensure Veterans get the care and services they need to be physically and mentally well.
Applications received per month on average
2023–24: 6,700
2024–25: 7,200
Disability benefits 16-week service standard results:
2020–21: 30%
2021–22: 46%
2022–23: 55%
2023–24: 69%
2024–25: 47%
Managing growth while improving service
- Between 2015–16 and 2024–25, disability benefit applications rose by 92%. Reducing processing times for these applications is a top priority.
Since 2021–22, the average wait for a first application dropped by nearly half – from about 40 weeks to 21. From March 2020 to March 2024, with the help of temporary employees, we reduced the backlog of disability benefit applications by 75% from over 22,000 to about 5,600 applications. However, by March 2025, the backlog grew again to over 11,000. In 2023–24, 69% of first applications met our 16-week service standard – up from just 30% in 2020–21. But in 2024–25, that dropped to 47%, due in part to a 7% increase in applications and a loss of trained decision-makers. Still, we completed 6% more applications than the year before.
We are taking action to reduce the backlog and speed up decisions. This includes a long-term staffing plan, automating some tools, and modernizing our services.
Investments in research
- We invested over $2.1 million from the Veteran and Family Well-being Fund in three new research projects on women Veterans and brain injuries.
- We continued to fund the Centre of Excellence for Chronic Pain and the Atlas Institute for Veterans and Families. These organizations lead important research on chronic pain and mental health and build strong partnerships with Veterans, providers, and communities.
Health and well-being studies
- We continued working with Department of National Defence (DND) on the Canadian Forces Cancer and Mortality Study Cancer Incidence project to study cancer rates in male and female Veterans. This research compares Veterans to the general population to better understand the risks of military service. These findings will help guide cancer prevention, health services, and benefits for CAF members and Veterans.
- In October 2024, we published a report based on the 2022 Canadian Veteran Health Survey (CVHS). It highlights health, employment, daily life, and finances across the Veteran population, with comparisons by gender and, where possible, to the general population. This was one of the first reports to show sex- and gender-specific results for all Canadian Veterans.
- We launched the second Canadian Veteran Health Survey to ask Veterans about their physical and mental health, jobs, income, social life, and use of health care services.
Community Health Needs Assessment
- In October 2024, we published the Community Health Needs Assessment (CHNA) report to highlight health and well-being priorities for Canadian Veterans, guide decisions, and support resource planning. This report gave us a better understanding of the strengths and needs of our diverse Veteran population. We shared the findings:
- across our department, with Veterans and stakeholders, and at the 2024 Canadian Institute for Military and Veteran Health Research (CIMVHR) Forum;
- with the Canadian Armed Forces, Atlas, the Centre of Excellence on Chronic Pain, and several Veteran organizations;
- as evidence for the Standing Committee on Veterans Affairs (ACVA) study on Indigenous, Black, and racialized Veterans;
- as support for the development of VAC’s mental health and women Veteran research plans; and
- to inform the Minister’s Health and Well-being Advisory Group on Veteran health priorities.
- We launched the CHNA Veterans Well-being Online Survey which closed in September 2024. It collected more information on the health and well-being of Veterans – especially those from equity-deserving groups. We will share the results when available.
Addressing gaps
- In 2023, we looked at where our programs were inconsistent—like differences in benefits, who qualifies, and how much we reimburse. In 2024–25, we improved Health Care Benefits by aligning coverage where possible, streamlining claims and reimbursement processes, and improving access to services. We made it easier for Veterans to access massage therapy by removing the need for a prescription. These changes help make health care benefits more fair and supports Veterans’ physical and mental well-being.
- We worked with Indigenous Services Canada to launch the Indigenous Veterans Health Project. This project helps Indigenous Veterans and their families access culturally safe mental wellness supports. Together, we built a strong partnership, created a clear process, and set up tools to track progress and gather feedback. This project helps more Veterans learn about and access mental health services, supports consistent service delivery, and contributes to our goal of helping Veterans stay physically and mentally well.
Presence in the North
- We completed 13 outreach visits to Northern Communities— including the Northwest Territories, Yukon, Nunavut, and Northern Quebec—meeting our goal of 12 annual trips. During these trips, we provided in-person services to Indigenous Veterans, Canadian Rangers, CAF and RCMP members, and other Veterans in remote areas. We met with 89 clients face-to-face, attended two tradeshows and a Remembrance Day ceremony, and connected with local health professionals, Indigenous organizations, Friendship Centres, and Royal Canadian Legions. We also gave more than 10 presentations to raise awareness about VAC programs and how to access them.
Improving access to mental health care
- We updated the Post-traumatic stress disorder (PTSD) Coach Canada App to make it easier for Veterans to get mental health support. The new version is more user-friendly and includes new tools to help manage PTSD symptoms. One important feature is a self-guided safety plan to help prevent suicide. In 2024–25, the Mental Health Commission of Canada reviewed the app and confirmed it is safe, high quality, and works well.
- We made it easier for Veterans to get mental health care by adding new virtual service options for providers such as social workers, therapists, and psychologists. By March 2025, over 8,300 Veterans used virtual care, with claims totaling more than $24 million. These changes help ensure Veterans can get the mental health support they need to stay well, both physically and mentally.
- We continued work on a new online therapy option called Therapist-Assisted Internet-Based Cognitive Behavioural Therapy (TA-iCBT). It’s designed for Veterans who need help with mild-to-moderate depression and anxiety disorders, including phobias. This program helps reduce barriers like distance and stigma. We’ve set the rules and criteria for providers and programs, and we plan to launch TA-iCBT in fall 2025. As part of a stepped care approach, it will help Veterans get early support and move to more intensive care if needed.
Improving access and oversight in medical cannabis
- We developed key operational changes to improve oversight and delivery of the Cannabis for Medical Purposes program, including a new pre-authorization form. This form will help simplify our authorization process by allowing authorizations in the client’s name (as opposed to the client’s licensed seller), and eliminate the need for medical and supporting documents. It will also collect critical data to support risk monitoring and inform future policy and operational decisions. These proposed changes are expected to roll out in 2025–26. We are also working with the Federal Health Claims Processing Services contractor to add more providers to electronic claims. This will speed up approvals and lower administrative costs.
Operational Stress Injury (OSI) clinic outcomes: Mental health improvements (2024–25)
- 54% of OSI clinic clients reported better mental health
- Up from 51% the year before
- Well above the 35% improvement seen in research studiesHansen, Lambert & Forman, 2002.
Expanding peer support and culturally safe spaces
- The Operational Stress Injury Social Support (OSISS) program offers peer support to CAF members, Veterans, and their families living with operational stress injuries. In 2023, we launched Mamawi—an Algonquin word meaning “together”—as a safe space for Indigenous Veterans to share their experiences. The group met monthly in 2024–25, supporting 5 to 10 peers at each of its 11 sessions. That same year, we expanded our efforts to reach more Indigenous communities and offer culturally appropriate services.
Better providers, better care
- We are making it easier for Veterans to access health care providers. In 2024–25, we added over 26,000 new providers to the Medavie Blue Cross registry, after adding more than 52,000 the year before. We also reviewed and raised the maximum fees we cover for professionals like social workers, psychologists, and psychotherapists.
- We cleared the backlog of health care provider issuesPotential provider issues could include the following: a provider presents a risk to clients’ physical, psychological and/or financial safety; suspected issues with professional boundaries, ethics and/or scope of practice; suspected fraudulent activity by the provider (e.g., submitting claims when services were not rendered); a provider no longer meets our provider criteria or provider is not abiding by the written requirements to be a registered provider; provider is no longer in good standing with their relevant regulatory body; and/or persistent issues with quality and/or timeliness of reporting. and now focus on new ones as they come in. This helps us respond faster to urgent problems and learn from past issues to prevent them in the future. In 2024, we opened 138 provider escalations and audits and closed 119. We also launched a pilot project to improve provider credential checks, targeting about 33,000 high-priority providers. The project tests ways to improve reporting, helping ensure safe, high-quality care for Veterans.
- We worked to improve care for Veterans with complex health needs by supporting Interdisciplinary Clinics (IDCs) that bring together different health professionals to provide coordinated treatment. In 2024–25, we continued reviewing applications from clinics seeking IDC recognition and worked to make the program easier to manage and to improve how we collect information. This includes tracking accessibility features and languages spoken, including Indigenous languages. Better data helps us match Veterans with the right care and makes sure we are funding high-quality services.
Departmental Result: Veterans and their families are financially secure
Results achieved
We took action to help Veterans access the benefits they’ve earned, build financial knowledge, and get support during emergencies. We made benefits easier and faster to access, expanded financial literacy efforts, clarified policies intended to help low-income Veterans return to work, and provided urgent help to Veterans in crisis. These efforts all work toward one goal: helping Veterans and their families stay financially stable.
Faster, easier access to benefits
- In 2024–25, temporary funding helped the Bureau of Pension Advocates to complete 6,083 more cases, bringing their total to 20,255—a 43% increase from last year. At the same time, they worked to improve their systems to speed up case processing and reduce the backlog. This helps ensure Veterans get the financial benefits they deserve.
- We continued modernizing our systems to help Veterans get the benefits they’ve earned faster and more easily. Through our IT modernization project, we are building a better platform that reduces wait times and makes it easier to apply for support. These changes help strengthen Veterans’ financial stability by making sure benefits arrive when and where they are needed.
Building financial knowledge and support
- We have been studying how Veterans are doing financially. One study looks at income data from Veterans who released between 1998 and 2019, tracking income trends and job types. Another study uses 2021 Census data to look at Veterans’ income, employment, and poverty levels, comparing these with the general Canadian population. We expect to release these reports in Fall 2025.
- During Financial Literacy Month in November 2024, we launched online training to help our employees understand financial literacy and the resources available to Veterans. We also shared tools and tips from the Financial Consumer Agency of Canada on Facebook, X, and LinkedIn to raise awareness, reduce stigma, and encourage open conversations about money.
- We continued our “Money Matters” article series in the Salute! newsletter. Topics covered included debt management and saving for emergencies, with links to online tools. While we do not offer financial counselling, we updated our website to include financial literacy resources like:
- Service Income Security Insurance Plan (SISIP) Financial Webinars – Live and recorded sessions to build money skills and plan ahead.
- “Your Financial Toolkit” – A full learning program to help adults manage their finances with confidence.
Improving support for Canadian Forces Income Support (CFIS) recipients
- In April 2024, we introduced a clearer policy for the CFIS program. It explains that recipients need to take part in approved Career Transition Services (CTS) and job search activities. This helps low-income Veterans and their families return to work and build financial security. The updated policy:
- Refers CFIS recipients to our CTS program for an initial assessment of their skills and interests.
- Clarifies when someone may be exempt from participating in CTS.
- To support this change, we launched a new training module in 2024 to help employees manage CTS participation. We’ve also continued the development of the business processes that support this work.
Emergency aid for Veterans in crisis
Income support for Veterans (2024–25)
As of March 31, 2025, about 32,627 Veterans and their families received the Income Replacement Benefit. Of those, 21,621 Veterans with a Diminished Earning Capacity are receiving lifelong financial support. We paid over $1.43B dollars in income replacement benefits during the fiscal year.
- In 2024–25, we approved 1,069 Veterans Emergency Fund applications to support Veterans and their families facing sudden financial crises affecting their health and well-being. This flexible program helps us respond quickly in emergencies. About 87% of those who received help were also connected to other VAC programs or community supports for longer-term needs.
Departmental Result: Veterans have a sense of purpose
Results achieved
In 2024–25, we helped Veterans find purpose through meaningful work and smoother transitions to civilian life. We launched the first National Veterans Employment Strategy, supported hiring in the federal public service, and connected Veterans with employers through outreach and events. Many Veterans used our Career Transition Services, with strong results in job placements, education, and satisfaction.
Advancing Veteran employment in public and private sectors
- In June 2024, we launched the first National Veterans Employment Strategy to help Veterans find meaningful careers. The strategy focuses on four goals:
- improving services;
- supporting Veteran-ready employers;
- promoting public service careers; and
- building strong partnerships.
We’ve already launched 90% of the action items and are on track to complete half of them within the first year.
- We have also taken big steps to support Veteran hiring across the federal public service. We created a government-wide Community of Practice – a network of Human Resource (HR) professionals – to share ideas, improve hiring and retention, and promote peer-to-peer support. We are working closely with partners like the Public Service Commission, CAF Transition Group, and DND to make sure Veterans and their families know about federal public service job opportunities.
- We continued to engage Veterans and communities through outreach activities, including a strong presence at the 2025 Invictus Games. We hosted three webinars with over 2,000 registrants, delivered 135 unique presentations, and helped arrange 250 one-on-one interviews between Veterans and employers.
Supporting transition to life after service
- In 2024–25, we helped over 2,100 Veterans through our Career Transition Services. The results were strong:
- about 88% achieved at least one successful outcome;
- nearly 78% found jobs; and
- almost 18% returned to school or training.
Education and Training Benefit (2024–25)
We received 5,559 new applications, a 12% increase from last year. We continue to promote the Education and Training Benefit through social media and outreach with our partners.
Our Job Development Services led to 107 job placements from 591 job presentations, with strong retention after 12 months. Over 92% of participants said they would recommend the service.
Departmental Result: Veterans are able to adapt, manage, and cope within post-service life
Results achieved
We are working to make the transition to life after service easier for Veterans and their families. We reviewed our current process and tested new tools and services. We also improved rehab services by building personalized plans, sharing information securely, and asking for feedback along the way. These efforts help us better support Veterans during and after their transition.
Transition support
- We worked to improve the transition experience for Veterans and their families by reviewing our current process, listening to feedback, and testing new tools and services. Some of our achievements:
- We reviewed how well the transition process supports life after service:
- Over 300 Veterans, former RCMP members, and their families shared feedback through Let’s Talk Veterans. We also used data from the VAC National Client Survey (VNCS) and CVHS to guide improvements.
- A working group for Enhanced Transition Services (ETS) Renewal was formed – made up of VAC, CAF, and Military Family Services – responsible for reviewing processes, developing new training and improving procedures. A new service model will be tested in 2025–26.
- We tested a quality control plan to monitor and improve the transition process, which will be finalized by fall 2025.
- We continued working with DND to simplify services and strengthen support for those leaving the military.
- We extended the Veteran Family Telemedicine Service pilot to 2027 and will expand further in fall 2025 to include more families without a family doctor.
- We reviewed what information we need from CAF and began building a data inventory. This will help us streamline our internal processes and identify opportunities to improve service delivery through automation and better system integration.
- We delivered 36 updated My Transition Seminars across Canada, focused on key transition needs for members and their families. The content is also available online.
- We reviewed how well the transition process supports life after service:
- In spring 2024, we shared the Veterans Resource Directory (downloadable list) with our frontline employees, including Health Professionals and Client Service Teams. This directory lists over 250 organizations across Canada that offer services in both English and French. It helps our employees connect Veterans with local programs and supports in their communities. In fall 2024, we published the directory on our website so Veterans and service providers across Canada can access it directly.
Transition interviews – highlights (2024–25)
- Total transition interviews completed: 5,569
- Who it is for: Releasing members of the CAF and RCMP, and their families
- Purpose: To support a smooth and successful transition to post-service life
What we provide during a transition interview:
- Information on our programs and services
- Guidance on applying for disability benefits
- Referrals to a case manager or Veteran service agent
- Connections to community service providers
Transition interviews are a vital step in preparing for life after service—ensuring members and their families are informed, supported, and connected.
Working together for better rehabilitation outcomes
- We work closely with participants to develop personalized rehab using a team-based approach that meets their needs. Our Rehabilitation services are delivered across Canada and respect each person’s language, gender, culture, and abilities. We securely share assessments and reports between VAC, Partners in Canadian Veterans Rehabilitation Services (PCVRS), health care providers, and participants to make sure services are well-coordinated and timely. We ask participants for feedback at three points during their rehab journey, and early results show that 79% are satisfied with their progress. We also found some misunderstandings about the program’s purpose, so we are developing new training and communication tools.
Case management in action
- As of March 2025, we were supporting 15,618 clients through our Case Management services. During the fiscal year, 5,196 clients completed their case management plans. When case management plans are completed, our case managers help clients move on to either Guided Support or Targeted Assistance. Case management is a team effort. We work with each client to understand their needs, set goals, and build a plan that helps them reach their highest level of independence, health, and well-being.
Departmental Result: Veterans are living in safe and adequate housing
Results achieved
In 2024–25, we strengthened our support for Veterans through housing and healthcare initiatives. We expanded efforts to prevent and reduce Veteran homelessness by partnering with other departments, funding community organizations, and increasing outreach. We also launched a national pilot to improve home adaptations and continued to provide long-term care funding to help Veterans live safely and comfortably.
Addressing Veteran homelessness
- We partnered with Housing, Infrastructure and Communities Canada (HICC) to deliver the Veteran Homelessness Program. This included agreements with 34 organizations—6 focused on research and program development, and 28 providing direct support like rent assistance and wraparound services to support those with complex needs.
- As of March 2025, we were providing direct support to 253 Veteran clients who experienced or were at risk of homelessness. We actively managed their cases to connect them with our programs and services, community resources, and other federal supports to address their needs.
- We supported 16 projects through the Veteran and Family Well-Being Fund (VFWF) to help Veterans who are homeless or at risk. One project was new, five were completed, and we awarded $800,000 in new funding.
- We worked with partners building affordable housing for Veterans.
- We met in person with over 25 homelessness organizations to raise awareness about our services.
- We also connected with 40 more organizations online and shared resources to help them support Veterans.
- We continue to work with local partners, shelters, and community services to identify and support Veterans facing homelessness.
Home adaptations pilot
- We launched the Home Adaptation pilot project on April 1, 2024, and included 27 cases so far. These early cases gave us helpful insights, but we need more data to make strong recommendations, therefore, we are expanding the pilot nationally into 2025–26.
Veterans Independence Program highlights (2024–25)
- 78,309 Veterans, caregivers, and survivors received over $390M support through the Veterans Independence Program
- Funding helped recipients stay independent in their homes and communities
- Supports access to home care and essential services
- Contributes to Veterans’ physical and mental well-being
Long term care support
- By the end of 2024–25, we helped fund long-term care for 1,868 Veterans. This support covers care, enhanced services, and helps with the cost of housing and meals. It ensures Veterans have the financial help they need and live in safe, suitable housing.
Departmental Result: Veterans are socially supported
Results achieved
We strengthened social support for Veterans by funding community-based services, expanding access to mental health and peer support, and promoting resources for those affected by military sexual trauma. Through partnerships, outreach, and targeted programs, we helped Veterans and their families connect with the services they need to feel supported, understood, and included in their communities.
Community-based support and services
- In 2024–25, we supported 81 community-based projects that helped Veterans and their families with housing, jobs, mental health, and other services. Of these, 27 were new and 32 were completed during the year. We provided $14.4 million in new funding for these initiatives.
- In spring 2024, we shared the Veteran Resources Directory—a list of over 250 organizations—with our front-line employees to help connect Veterans to local services. In fall 2024, we published the directory on our website so Veterans and service providers across Canada can access it directly.
Support for Military Sexual Trauma
- We worked with the Sexual Misconduct Support and Resource Centre to support those affected by Military Sexual Trauma (MST). We promoted the peer support program through articles in Salute! and Maple Leaf, and posts on Facebook, X, and LinkedIn. We also shared information sheets with front-line employees and gave presentations to Field Operations, OSISS, and the Minister’s Advisory Group.
Mental health and peer support
- Through the Peer Support Program, we ran four formal groups, five informal groups, and other peer support activities with over 100 participants combined. Feedback showed that Veterans valued the safe, supportive space, felt understood, and gained strength from knowing they were not alone.
- We continued working with the Mental Health Commission of Canada to offer mental health literacy training to the Veteran community. In 2024–25, we held 13 Mental Health First Aid sessions with 142 participants.
Departmental Result: Veterans are satisfied with the services they receive
Results achieved
We worked hard to improve how we serve Veterans. Over the past year, we modernized our tools and used new technology to speed up decisions. We also made it easier for Veterans to apply for benefits and access services online. Most Veterans told us they are satisfied with the support they receive, and we continue to listen and make changes based on their feedback. Our goal is to deliver faster, fairer, and more personalized service to every Veteran we support.
Taking action to reduce wait times
- Between 2015–16 and 2024–25, disability benefit applications rose by 92%. Despite this, since 2021–22, we have cut the average wait time for first applications by nearly half. From 2020 to 2024, we reduced the backlog by 75%. Although the backlog increased again by the end of 2024–25 due to a rise in applications and the loss of some trained decision-makers, we still completed more applications in 2024–25 than the year before. These efforts have improved service delivery, which is closely tied to how satisfied Veterans feel with the support they receive. We are working on a number of actions to reduce the backlog of applications and to make decisions faster for Veterans and their families.
- We used automation to help Veterans get their benefits faster and with less effort. When someone applies for a new disability benefit, our system now automatically checks whether Service Health Records (SHRs) or updates are needed—and if so, it sends the request directly, reducing paperwork and delays. We're also exploring the use of artificial intelligence (AI) to scan medical and service records, highlighting key information to support employees to make faster, more accurate decision-making. In addition, we’ve completed work that allows the system to prepopulate parts of disability benefit letters, helping to streamline the process and save time.
- We are also building automation tools to help identify medical documents submitted by healthcare providers. Once in place, these tools will recognize the type of form, apply the correct code, and send it directly to the client’s file—without needing a person to review and sort it first. In the future, we plan to expand this to handle more types of documents and possibly other systems.
- We made strong progress in reducing the gap in processing times for applications from female and Francophone Veterans. In 2024–25, the average processing time for first applications was 20.4 weeks for female Veterans and 21.0 weeks for male Veterans. Francophone applications averaged 20.5 weeks, compared to 20.9 weeks for Anglophone applications. These gaps will continue to fluctuate over time.
- The Bureau of Pensions Advocates (BPA) has improved its processing times, meeting its service standard in 54% of cases, up from 41% in 2023–2024. BPA also continues to invest in a major project called DARE (Digital Age Renewal), which focuses on digital innovation to improve processing and reduce wait times for Veterans awaiting review decisions from the Veterans Review and Appeal Board (VRAB). As part of this work, BPA introduced a new Early Resolution Session process with the Board, which has helped resolve over 900 cases in favour of Veterans.
Making it easier to apply and access services
- We created a five-part video series and updated several articles to help explain the disability benefit application process. These resources cover what information is needed, how to write applicant statements, complete medical questionnaires, and more.
- In March 2025, we completed Public Opinion Research with My VAC Account users. Most users are happy with their experience; 75% said they are satisfied, including 34% who are very satisfied. Seventy-three percent said they can find most or all of the information they need. Many use My VAC Account to apply for benefits (91%), upload documents (84%), track applications (88%), get messages from us (84%), use secure messaging (83%), and view their benefits summary (83%). Some users recommended improving access to forms and simplifying certain processes.
Strengthening Veteran engagement and inclusion
- This year, we held 20 meetings with our six Ministerial Advisory Groups to improve services and support for Veterans. The Minister responded to recommendations, and more are expected in May 2026. We also hosted consultations, roundtables, and forums, including the 2024 2SLGBTQI+ Veterans Forum and the Honouring Her Service: 2025 Women’s Forum. We published the 2SLGBTQI+ Veterans Forum report and are preparing a follow-up report with action items based on the 2025 Women’s Forum.
- In December 2024, we established a Women Veterans Council. Guided by members’ lived experiences and expertise, the Council will offer insight to the Minister on issues that matter to women who serve or have served in the CAF and RCMP.
- In February 2025, we signed a Letter of Understanding with the Assembly of First Nations to support shared goals in Veteran engagement, outreach, and commemoration. We also held two full-day meetings with the National Métis Veterans Council to talk about their priorities such as recognition and access to VAC benefits and services.
Collaborating to improve support for Military Sexual Trauma and LGBT Purge Survivors
- We are part of the Canadian MST Community of Practice, where we work with more than 40 researchers, clinicians, policy leaders, and individuals with lived experience. Together, we share knowledge, explore ways to increase research, and raise awareness to improve understanding of MST and how it is addressed.
- We also funded a study through the Joint Federal Research Funding Program called “Experiences of LGBT Purge Survivors with VAC Programs and Services”. Led by the MacDonald Franklin OSI Research and Innovation Centre, the study explores the barriers and supports LGBT Purge survivors experience when accessing our services. It will help us improve our programs by considering factors such as sex, gender, age, sexual orientation, and military experience. The final report is expected in fall 2025.
Enhancing medical services and support for Veterans
- We continued improving how we deliver medical reassessments for disability benefits by offering both in-person and virtual options through our Field Medical Services. We are working to increase the number of pension medical exams completed and to make sure services are available in every province. New client letters now give Veterans the choice to meet with us in person or online, and we are improving My VAC Account to make it easier for clients to reach us and apply for reassessments.
- We have made strong progress in improving processing times for files awaiting medical consultations and reassessment action times. By reviewing processes, adding more trained employees, and dedicating focused file review weeks, we have cut the backlog by over 40%. We have also added bilingual employees to process the oldest claims faster, no matter the client’s language.
- We worked to modernize our Nursing Assessment Tool to collect better health data and reduce the need for Veterans to repeat their health history. This will help us create more personalized care plans and supports future research. We are also reviewing the Nursing Services Treatment Benefit to improve policies and procedures, leading to more consistent and higher-quality decisions in nursing care.
Preparing for the next phase of health claims processing services
- We reviewed key documents including business processes, forms, letters, and communication materials. This work prepared the essential information needed to support the awarding of the next Federal Health Claims Processing Services contract. In March 2025, Public Services and Procurement Canada awarded the contract to Medavie Blue Cross. The new contract will begin in August 2027 and will continue to provide smooth health care authorization and claims reimbursement services for Veterans, Canadian Armed Forces members, and RCMP members.
Updating tools for better disability benefit decisions
- We continued to modernize the Entitlement Eligibility Guidelines (EEGs) and Table of Disabilities (TOD) to improve fairness and consistency in disability benefit decisions. As of March 2025, we’ve updated 22 EEGs, created 10 new ones, and released a revised TOD chapter on Additional Pain and Suffering Compensation, with more updates planned for 2025.
Improving data and representation
- We worked with Statistics Canada to include Veteran data in national surveys like the Indigenous Peoples Survey, the Canadian Survey on Disabilities, and the Canadian Housing Survey.
- We continued to advocate to include a Veteran question in the 2026 Census to improve research, understanding, and support for all Veterans, especially for equity-deserving groups.
Satisfaction level with VAC and Case Management Services: 2024 VNCS Results
- Results show that 77% of clients are satisfied with the overall quality of our services.
- Among clients with a case plan, 75% are satisfied with Case Management Services.
Resources required to achieve results
Table 8: Snapshot of resources required for Benefits, Services and Support
Table 8 provides a summary of the planned and actual spending and full-time equivalents (FTEs) required to achieve results.
The Finances section of our Infographic on GC Infobase and the People section of our Infographic on GC Infobase provide complete financial and human resources information related to our program inventory.
Related government priorities
This section highlights government priorities that are being addressed through this core responsibility.
Gender-based analysis plus (GBA Plus)
- We found in the 2022 Horizontal Evaluation of Program Alignments that we need better data to support intersectional analysis, including race, income, gender, religion, language, and education. This recommendation drove us to start a partnership with Statistics Canada in 2024–25 to improve our GBA Plus work.
- We worked with Statistics Canada to anonymously link 2021 Census data to over 100,000 Veterans who used our services in 2020–21. This data includes socio-demographic details like gender, income, education, housing, and disability. It helps us better understand our clients, including women, Indigenous, and racialized Veterans. We will keep focusing on program-specific data and use what we learn to improve services. Using existing data also reduces the need to ask clients for more information.
- We continue to develop new reporting for the Veterans Independence Program based on a data validation exercise. This will give us better tools to manage the program, make decisions, track performance, and carry out GBA Plus analysis. The goal is to be able to break down client data by age, gender, and location (urban or rural).
- In March 2025, we published results from the 2024 VAC National Client Survey. Over 3,800 Veterans, RCMP members, and survivors told us how they feel about our programs, services, and their overall well-being, including life satisfaction, finances, relationships, housing, and health. The survey showed most people are happy with our services and how we treat them. But women Veterans were less satisfied in some areas, like treatment benefits. Indigenous and racialized Veterans also reported lower well-being in some areas. The report compares results by age, gender, and identity to help us understand and improve.
- As part of our Veteran-centered, GBA Plus-informed approach, we continued modernizing the EEGs and TOD to support more equitable, consistent, and timely disability benefit decisions.
- Since 2020, OSI clinics have collected GBA Plus-specific data, showing that 22% of referred clients identify as female. All clinics offer individual, group, and family services to support female clients, and several provide gender-specific group treatments, including new 2SLGBTQIA+ initiatives. Operational Stress Injuries National Network applies a GBA Plus lens to all its activities and initiatives.
Further information on governance, capacity, and program-specific data collection plans can be found in our GBA Plus Supplementary Information Table
United Nations (UN) 2030 Agenda for Sustainable Development and the UN Sustainable Development Goals (SDGs)
We supported Canada’s efforts in relation to the UN’s 2030 Agenda for SDGs. Of the 17 SDGs, this core responsibility contributed to these specific goals:
SDG 1: No Poverty
- Income Support; Transition Services; Health Care Services; Long Term Care; Caregiver Recognition Benefit directly contributed to this SDG.
SDG 3: Good Health and Well-being
- We support Veterans with a wide range of needs and levels of complexity. We regularly assess their situations to make sure they get the right level of support. Veterans can move through different levels of service as their needs change. We use evidence and ongoing evaluation to guide our case management practices and improve outcomes.
- We offered several programs that support the health and well-being of Veterans and their families, such as the Veteran Independence Program, Health Care Benefits, and Long-Term Care.
SDG 4: Quality Education
- We offered several programs that provide financial support for education, training and their related financial costs for Veterans and their families.
SDG 5: Gender Equality and SDG 10: Reduced inequalities
- We reduced the difference in processing times between male and female applicants. In 2024–25, the average processing times for first applications were 20.4 weeks female applicants and 21.0 weeks for male applicants. This has been an improvement from past years. In the previous fiscal year, the times were 22.3 weeks for females and 19.8 weeks for males. Back in 2020–21, it took much longer—54.1 weeks for females and 47.9 weeks for males. Even though the gap may fluctuate over time, we are making strong progress toward fairer processing times for everyone.
SDG 8: Decent Work and Economic Growth
- We offered several programs to help CAF Veterans find jobs and provide other career-related services and information.
SDG 11: Sustainable Cities and Communities
- We partnered with Housing, Infrastructure and Communities Canada to deliver the Veteran Homelessness Program. We worked with other partners to support Veterans who are homeless or at risk. We funded projects focused on this issue, helped build affordable housing, and shared info about VAC services with community groups to better connect Veterans with the help they need.
SDG 16: Peace Justice, and Strong Institutions
- BPA lawyers are considered the leading expert redress legislation for Veterans, especially the Department of Veterans Affairs Act, the Veterans Review and Appeal Board Act, the Pension Act, the Veterans Well-being Act, and the War Veterans Allowance Act. The Bureau helps Veterans by representing them for free at the Veterans Review and Appeal Board. This support helps Veterans get the disability benefits they deserve. By doing this, BPA promotes fairness and makes it easier for everyone to access justice.
More information on our contributions to Canada’s Federal Implementation Plan on the 2030 Agenda and the Federal Sustainable Development Strategy can be found in our Departmental Sustainable Development Strategy.
Program inventory
The core responsibility “Benefits, Services and Support” is supported by the following programs:
- Caregiver Recognition Benefit
- Disability Benefits
- Health Care Benefits
- Income Support
- Long Term Care
- Research and Innovation
- Transition Services
- Veterans Emergency Fund
- Veterans Independence Program
- War Veterans Allowance
Additional information related to the program inventory for Benefits, Services and Support is available on our Results page on GC Infobase.
Core responsibility 2: Commemoration
Description
Pay tribute to the sacrifices and achievements of those who served in Canada’s military efforts.
Quality of life impacts
The work we did to fulfill this core responsibility may have had a positive impact on the following QoL domains and indicators:
- Society: Sense of pride/belonging to Canada; Participation in cultural or religious practices, recreation or sport; Sense of belonging to local community
- Sense of meaning and purpose
- Environment: Conserved areas
Progress on results
This section details our performance against our targets for each departmental result under Core responsibility 2: Commemoration.
Table 9: Veterans and those who died in service are honoured
Table 9 shows the target, the date to achieve the target and the actual result for each indicator under “Veterans and those who died in service are honoured” in the last three fiscal years.
Table 10: Canadians remember and appreciate Veterans and those who died in service
Table 10 shows the target, the date to achieve the target and the actual result for each indicator under “Canadians remember and appreciate Veterans and those who died in service” in the last three fiscal years.
The Results section of our Infographic on GC Infobase provides additional information on our results and performance related to our program inventory.
Details on results
The following section describes our results for Commemoration in 2024–25 compared with the planned results set out in our departmental plan for the year.
Departmental Result: Veterans and those who died in service are honoured.
Results achieved
In 2024–25, we honoured Veterans and all those who served Canada through ceremonies, events, and educational programs. We worked with partners in Canada and around the world to mark key anniversaries including D-Day, the Italian Campaign, and peacekeeping missions in Cyprus and Rwanda. We supported the 2025 Invictus Games, where Veterans and military members competed and connected with communities. We shared stories, developed learning tools, and used digital platforms to help Canadians of all ages remember and recognize the sacrifices of those who served. Through it all, we made sure to include Indigenous voices, underrepresented groups, and youth in our efforts to keep remembrance alive.
Commemorative events, ceremonies, and stakeholder engagements
- We partnered with the Government of Newfoundland and Labrador and the Canadian Armed Forces to deliver a special commemorative program in France. Ceremonies were held at several Newfoundland caribou memorials to honour the Royal Newfoundland Regiment, including a major event at Beaumont-Hamel to honour all Newfoundlanders and Labradorians who served, especially those with no known grave. We repatriated the remains of an unknown First World War Newfoundland soldier. Veterans, Indigenous representatives, RCMP members, politicians, and others—many from Newfoundland and Labrador—took part. Ramp ceremonies were held in France and Canada, including a full funeral on 1 July in St. John’s. The France event was livestreamed on our “Canada Remembers” Facebook page, and the St. John’s events were broadcast and livestreamed nationally.
- To mark the 80th anniversary of D-Day and the Battle of Normandy, we held events in Canada and France. In France, we led the official Canadian delegation - including Second World War Veterans, their families, Veterans’ organizations, Indigenous representatives, parliamentarians, and CAF members - and hosted the main ceremony at Juno Beach on 6 June 2024. About 4,000 people attended, including 800 youth, the Prince of Wales, and the Prime Ministers of Canada and France. The ceremony was broadcast and livestreamed across Canada. In Canada, we held events in Dieppe and Moncton, where the French Ambassador awarded the Légion d’Honneur to three Veterans. Posts and videos received strong media attention and high online engagement, comparable to Veterans’ Week.
- To mark 60 years since Canada’s peacekeeping mission in Cyprus, we organized events in Cyprus and Canada. During Veterans’ Week, we led a delegation to Cyprus and held ceremonies, including a special event at the UN Memorial on Indigenous Veterans Day. Indigenous organizations nominated delegates with Cyprus service, who laid personalized wreaths, and a First Nations Knowledge Keeper participated throughout. The main Cyprus ceremony was livestreamed on our “Canada Remembers” Facebook page. In Canada, we held a ceremony at Ottawa’s Peacekeeping Monument, attended by Veterans and CAF members. The anniversary was also featured through storytelling, a dedicated webpage, and social media.
- We partnered with the Rwanda High Commission in Canada to mark the 30th anniversary of the UN mission to Rwanda. We hosted a learning day with Veterans and youth at the Canadian Museum for Human Rights in Winnipeg and held a traditional ceremony at the Peacekeeping Monument in Ottawa. Veterans, genocide survivors, and diplomats from the Rwanda High Commission attended, followed by a presentation hosted by the High Commissioner. We highlighted the anniversary through storytelling and social media.
- We marked the 80th anniversary of the Italian Campaign with a joint ministerial statement and a historical post on social media. We also laid a wreath at the National War Memorial in Ottawa to honour those who served.
- In February 2025, we supported the 7th Invictus Games in Vancouver and Whistler - an international sporting event for wounded, injured, and ill Veterans and active military members.
- We contributed $15 million over three years to help secure and deliver the 2025 Invictus Games. A total of 535 Veterans and serving members from 23 nations, including 55 from Team Canada, competed with support from 1,200 family and friends and more than 1,900 volunteers from across Canada and around the world.
- We welcomed approximately 125,000 spectators. The Opening Ceremony set an event record of over 42,000 attendees and reached 1.7 million unique Canadian viewers through broadcast.
- We engaged with more than 24,000 Canadian and international visitors at the Invictus Village, where Veterans staffed an exhibit highlighting the global service of the CAF.
- We worked with the Musqueam, Squamish, Tsleil-Waututh, and Lil’wat Nations—the Four Host First Nations—to plan and host the Games on their traditional lands. This partnership ensured Indigenous communities were included and their cultures, languages, and traditions were respected, in line with the Truth and Reconciliation Commission’s Calls to Action.
- We hosted Canada’s first all-Indigenous Veterans group at the Games, welcoming Veterans from Inuit, Métis, and First Nations communities. Along with youth and elders from the host Nations, they participated in cultural activities and explored how sport supports healing and recovery for Veterans, military members, and their families.
- We supported Veterans beyond the Games through the post-Games Legacy Fund, which invests in sports programs, family support, research, and employment opportunities for Veterans.
- We led the planning and delivery of programming, ceremonies, and an official Government of Canada delegation to mark key milestones. We involved Veterans, CAF members, their families, youth, Indigenous communities, and local residents in remembrance activities to honour those who gave their lives in service. These milestones included:
- Partnering with the Royal Canadian Air Force (RCAF) to mark its 100th anniversary.
- Commemorating the 108th anniversary of the Battles of the Somme and Beaumont-Hamel.
- Holding National Peacekeepers’ Day ceremonies in Angus, Hamilton, Calgary, and Winnipeg.
- Marking the Korean War Armistice with events throughout the year.
- Hosting a learning day to recognize the Canadian Rangers.
Commemorative learning products and educational initiatives
- We distributed over 2.8 million learning products to Canadians ahead of Veterans’ Week. These resources covered topics such as Canada’s mission in Afghanistan, RCAF100, service in Africa, D-Day and the Battle of Normandy, the Invictus Games, service in Rwanda and Cyprus, the Newfoundland Tomb of the Unknown Soldier, and Indigenous Veterans. We also shared stories of individual Veterans from diverse backgrounds. Materials for young learners focused on remembrance, recognition, memorials, Veterans, and peace.
- Throughout the year, we created and shared lesson plans on a range of topics and groups of Veterans, including the Canadian Rangers, Black Canadians who died in service, the Buffalo 9 peacekeepers, and 2SLGBTQI+ Veterans. We also launched full learning units with activities, videos, and lessons about the Newfoundland Tomb of the Unknown Soldier, Canada’s service in Rwanda, and Indigenous contributions to Canadian military history.
- We delivered more than 20,000 valentine cards to Veterans in long-term care and communities across Canada. We also shared over 800,000 recognition cards with schools and community groups to encourage youth to thank Veterans and helped raise awareness about the Invictus Games, the CAF’s role in the Americas, and Indigenous military history.
- We held learning day events to help students learn about Veterans and their service. In Ottawa, students tried adaptive sports at an Invictus event. In Winnipeg, we hosted an RCAF 100 event that highlighted the role of women in the Air Force.
- We worked with many groups to create, share, and promote learning materials. Our partners included the Royal Canadian Legion, the Canadian War Museum, the Royal Canadian Air Force, Black Canadian Veteran Voices, the Dallaire Institute, the Vimy Foundation, and others. We also helped develop education materials, including a project with Invictus Canada.
Public displays and digital initiatives
- We invested more into digital learning, especially videos, to make learning more accessible and engaging for all ages. In fall 2024, we released an animated video for young learners to help introduce remembrance activities. Teachers responded positively, and it received over 20,000 views on Facebook and YouTube. We also completed more animated videos and a video on Indigenous military history, which we will release next year with learning materials and activities.
- We began modernizing the Canadian Virtual War Memorial, which had not seen a major update in 20 years. Phase 1 started in 2024–25 and will finish in 2025–26. This online memorial is still one of the most visited areas of our website. In 2024–25, we added over 20,000 photos and other media to honour Canadians who died in military service.
- We expanded and promoted our “Canadian Armed Forces Around the World” programming. It was featured on our Veterans’ Week poster and in exhibits at the Invictus Games and Winterlude. In 2024, we focused on the CAF’s work in Africa. We created web and social media content, shared Veteran stories, and partnered with Canadian Heritage on street banners in Ottawa and Charlottetown. We also worked with the Dallaire Institute and Peace by Chocolate to give students a unique learning experience about CAF’s role in Rwanda.
Departmental Result: Canadians remember and appreciate Veterans and those who died in service.
Results achieved
In 2024–25, we focused on preserving and improving Canada’s overseas memorials. We repaired monuments, upgraded visitor centres, and made the sites safer and more accessible. We also planned for the future by developing visitor experience strategies and installing new technology. To protect the environment, we planted thousands of trees, modernized systems, and replaced vehicles with greener options. Everything we did helped honour those who served while making sure these sacred places stay strong, welcoming, and respectful for generations to come.
Upgrades, preservation, and maintenance
- A specialized Public Services and Procurement Canada (PSPC) team did important preservation work on the Vimy monument. They made a mold and secured weak areas of the south pylon carving, chose stone for future repairs, and fixed open joints—particularly near the Tomb. They also checked inside the pylons to assess the structure. At the same time, PSPC inspected the masonry and cellars at the Monchy-le-Preux Newfoundland Memorial and the caribou mound at the Masnières Newfoundland Memorial. We continued updating signs, installing about 90% of the new signs planned for both sites.
- We signed a three-year contract to keep the fountain at the Green Park Canada Memorial in London running well. This will help make sure the memorial stays beautiful for visitors.
- We worked with PSPC again to complete important stone repairs on the north and south towers of the Vimy monument. Skilled artisans carefully restored the towers and several damaged sculptures to help protect them for the future. We also carried out major site maintenance to prepare for fall commemorative events.
- We finished repointing of the retaining walls at the Hill 62 Canadian Memorial in Belgium, strengthening the site and improving its appearance.
- During the January closure of the Vimy and Beaumont-Hamel visitor centres, we finished upgrades that can only happen while the sites are closed. We painted, cleaned vents and display cases, updated flooring, and did plumbing and electrical work, and much more.
Enhanced visitor experiences
- We worked with stakeholders and partners to develop Visitor Experience Strategy (VES) reports for the Vimy and Beaumont-Hamel sites in France. These reports help us plan improvements over the next five years. They set clear goals, look at who visits now and who might visit in the future, and review what we currently offer. The reports also outline the best ways to grow and promote the sites, both in person and online. We used a GBA Plus approach to make sure the strategies and products reflect diverse perspectives and needs.
- We made several technology upgrades at the Vimy site. We added Wi-Fi to the administration building, added a new VoIP line onsite, and improved cell service at the Visitor Education Centre. We also installed a new entry and exit door system at the visitor centre, making access easier and cutting down on maintenance challenges. These upgrades improve the visitor experience by making the site more modern, connected, and user-friendly.
- We finished accessibility assessments for Green Park’s Canada Memorial in London, United Kingdom (UK) and the Newfoundland Gallipoli Memorial in Türkiye. With these, we have now assessed all 15 of our memorials in Europe. These assessments help us find ways to improve safety and make visits better for everyone.
Sustainable development and greening initiatives
- We made big improvements to the infrastructure at our international national historic sites to support sustainability and reduce our environmental impact. Key upgrades include:
- Fleet Greening Initiative: In November, we replaced two diesel vehicles with one electric and one hybrid vehicle – an important step in reducing our carbon footprint.
- Septic System Modernization: As part of Phase 1 of the Budget 2022 project, we installed a new septic field at the Vimy administration building, resolving long-standing maintenance issues.
- Beaumont-Hamel Upgrades: In February, we fully renovated the locker room and washrooms at the gardener base.
Forest Management
- We engaged the Commonwealth War Graves Commission to trim and protect the 200-year-old trees at the Bourlon Wood Canadian Memorial. This work keeps visitors and employees safe and supports the long-term health of the trees.
- We made strong progress on our environmental efforts by continuing the forest management and reforestation projects at the Vimy and Beaumont-Hamel sites. Before planting, we cleared the areas of old mines to keep everyone safe. Then, our team carefully planted over 3,000 trees chosen to support the health of the land while respecting the history of these sacred places.
- We finished horticultural upgrades at the Newfoundland Gallipoli Memorial. These improvements made the site look better and added shade and drought-resistant plants to help it thrive.
Resources required to achieve results
Table 11: Snapshot of resources required for Commemoration
Table 11 provides a summary of the planned and actual spending and full-time equivalents required to achieve results.
The Finances section of our Infographic on GC Infobase and the People section of our Infographic on GC Infobase provide complete financial and human resources information related to our program inventory.
Related government priorities
This section highlights government priorities that are being addressed through this core responsibility.
Gender-based analysis plus
We made sure to consider different identities, like women and Two-Spirit, Lesbian, Gay, Bisexual, Transgender, Queer or Questioning, Intersex, and other sexually and gender-diverse (2SLGBTQI+) communities, when we planned, delivered, and reviewed initiatives. To help more Canadians with disabilities or functional needs take part, we carried out the following activities:
- In April 2024, we sent the first 2SLGBTQI+ Veterans group to France and Belgium. We visited historic sites and took part in commemorative events. The group included members from Rainbow Veterans of Canada and The LGBT Purge Fund. We took part in the Vimy Ridge ceremony to honour 2SLGBTQI+ Veterans from the First World War.
- At the 2025 Women’s Forum, themed “Honouring Her Service”, and the 2024 2SLGBTQI+ Veterans Forum, we discussed ways to better recognize equity-deserving Veterans in our commemorative efforts. We gathered feedback to help us find gaps and improve how we honour Veterans in our activities.
- We continued improving our learning products to make sure they are inclusive and easy for all Canadians to use.
- We updated our Quality Visitor Experience (QVE) training with a more inclusive approach using GBA Plus. We delivered this training to our employees in France.
- We finished checking all 15 of our memorials in Europe for accessibility. In March 2025, we submitted the final two reports for the Canada Memorial in Green Park (UK) and the Newfoundland Gallipoli Memorial (Türkiye), achieving 100% completion.
- We made accessibility upgrades at God’s Acre, including the kitchenette, public restroom, and entryways of the maintenance building. We also added an accessible platform to the Chapel and improved the path between the Columbaria plateau and the Forest Garden Area. We are continuing the Chapel accessibility review to help more Canadians with disabilities or functional limitations take part and feel included.
United Nations 2030 Agenda for Sustainable Development and the UN Sustainable Development Goals (SDGs)
We recognized Veterans through commemorative initiatives that support overall well-being, particularly mental and social health.
SDG 3: Good Health and Well-Being
We supported good health and well-being by creating inclusive, reflective spaces that honour diverse Veterans, promote belonging, and encourage emotional connection through remembrance and education.
- We used inclusive images and language on welcome screens and in exhibits to show the diversity of Canada’s military history.
- We featured Faces of Freedom banners and RCAF100 exhibit at our sites in France that honoured women, Black, Indigenous, and French Veterans who served in the D-Day Campaign, the Liberation of the Netherlands, and the Royal Canadian Air Force. These displays helped visitors see the diverse faces behind Canada’s military history.
- We hosted exhibits on the history of sports in the military and the Invictus Games at our visitor centres in France. These exhibits celebrated the resilience and achievements of diverse Veterans – including those who are wounded, injured, or sick – and highlighted how sport supports recovery and well-being.
- We flew the Pride flag during Public Service Pride Week and shared stories online for Truth and Reconciliation Day and Black History Month.
- We began planning to renew the Beaumont-Hamel Visitor Centre exhibit to better tell Newfoundland and Labrador’s story.
- We added a permanent wreath station at Vimy to give visitors a quiet space to reflect and remember.
- We continued to support groups that honour underrepresented Veterans through our partnership program.
SDG 15: Life on Land:
We helped to protect and restore ecosystems by planting trees and improving the natural environment at our historic sites.
- In December 2024, we completed another phase of our reforestation project at the Vimy and Beaumont-Hamel memorials. Before planting, we safely cleared old mines from the area. Then, our team planted over 3,000 carefully chosen trees to support local biodiversity and enhance the landscape, while respecting the history of these sacred grounds.
SDG 13: Climate Action:
We took action to reduce our environmental impact and adapt our operations to be more climate-friendly.
- Our international sites team replaced two diesel vehicles with one electric and one hybrid, cutting emissions.
- During the January closure of the Vimy and Beaumont-Hamel visitor centres, we completed energy-efficient upgrades, including plumbing, electrical, and ventilation work.
- We modernized the septic system at Vimy and renovated the gardener base at Beaumont-Hamel, improving sustainability and reducing long-term maintenance needs.
More information on our contributions to Canada’s Federal Implementation Plan on the 2030 Agenda and the Federal Sustainable Development Strategy can be found in our Departmental Sustainable Development Strategy.
Program inventory
The core responsibility “Commemoration” is supported by the following programs:
- Canada Remembers
- Funeral and Burial Program
Additional information related to the program inventory for Commemoration is available on our Results page on GC Infobase.
Core responsibility 3: Veterans Ombudsperson
Description
Provide an independent and impartial review of complaints and issues related to programs and services delivered by the Veterans Affairs Portfolio and uphold the Veterans Bill of Rights.
Quality of life impacts
The work completed to fulfill this core responsibility may have had a positive impact on the following QoL domains and indicators:
- Good governance: Discrimination and unfair treatment; Confidence in institutions
Progress on results
This section details performance against the targets for each departmental result under Core responsibility 3: Veterans Ombudsperson.
Table 12: Veterans and their families have access to a timely review of complaints about the programs, services and support delivered by the Veterans Affairs Portfolio
Table 12 shows the target, the date to achieve the target and the actual result for each indicator under “Veterans and their families have access to a timely review of complaints about the programs, services and support delivered by the Veterans Affairs Portfolio” in the last three fiscal years.
Table 13: Issues about the programs, services and support provided to Veterans and their families by the Veterans Affairs Portfolio identified by the Office of the Veterans Ombudsperson are addressed
Table 13 shows the target, the date to achieve the target and the actual result for each indicator under “Issues about the programs, services and support provided to Veterans and their families by the Veterans Affairs Portfolio identified by the Office of the Veterans Ombudsperson are addressed” in the last three fiscal years.
The Results section of the Infographic on GC Infobase provides additional information on results and performance related to the program inventory.
Details on results
The following section describes the results for Veterans Ombudsperson in 2024–25 compared with the planned results set out in the departmental plan for the year.
Departmental Result: Veterans and their families have access to a timely review of complaints about the programs, services and support delivered by the Veterans Affairs Portfolio.
Results achieved
In 2024–25, the Office of the Veterans Ombudsperson (OVO) continued to strengthen its ability to deliver timely, fair, and accessible complaint resolution services to Veterans and their families. The Office focused on improving internal processes, enhancing service quality, and expanding outreach and engagement efforts.
- The OVO addressed 1,848 complaints and information requests—the highest number since 2019–20 and 72 more than the previous fiscal year.
- The Office continued to expand outreach and engagement efforts in 2024–25, connecting with hundreds of Veterans, serving members, families, and stakeholders through in-person and virtual town halls, visits to CAF Bases and Military Family Resource Centres, and participation in conferences and community events. These efforts helped raise awareness of the OVO’s services, gather valuable feedback, and help the Office stay informed about the changing needs of the Veteran community.
- The Office exceeded its service standard target by completing 93% of complaints within the 60-working-day service standard, surpassing the target of 85%.
- The OVO introduced several new tools and processes to improve fairness, consistency, and efficiency in complaint handling. These included implementing Documentation Guidelines and a Fairness Checklist to help analysts thoroughly assess cases and ensure each file contained clear and complete documentation.
- The Office streamlined its intake and case assignment process by enabling the immediate resolution of simpler complaints and information requests at the time of receipt. More complex cases were assigned to analysts, improving workload distribution and allowing for more timely responses to clients.
- The OVO decided against implementing call recording for quality assurance (QA) purposes as originally planned as they were not satisfied that it would enhance trust to record Veterans and therefore chose not to proceed in that direction. Alternatively, they developed and piloted a robust quality assurance process focusing on case documentation. The pilot was a success and will be fully implemented in 2025–26.
- To improve secure communication with clients, the OVO worked closely with VAC to advance the implementation of secure messaging through My VAC Account. Full implementation is anticipated in 2025.
- In March 2025, the OVO finalized a new organizational structure designed to improve both service quality and timeliness. The Office will fully implement this structure in September 2025, which will include the creation of Senior Investigator positions responsible for managing more complex cases and contributing to systemic review work. The new structure will also establish a clearer separation between intake/early resolution and complex investigations, aligning the Office with leading practices used by other Ombud organizations.
- The Complaints Review Committee continued to provide advice to support complex case management and assist in the preparation of cases for escalation by senior management to advance fair resolution for Veterans and their families.
- The OVO continued to expand its outreach and engagement efforts in 2024–25, connecting with hundreds of Veterans, serving members, families, and stakeholders through in-person and virtual town halls, visits to CAF Bases and Military Family Resource Centres, and participation in conferences and community events. These efforts helped raise awareness of the OVO’s services, gather valuable feedback, and help the Office stay informed about the changing needs of the Veteran community.
Departmental Result: Issues about the programs, services and support provided to Veterans and their families by the Veterans Affairs Portfolio identified by the Office of the Veterans Ombudsperson are addressed.
Results achieved
In 2024–25, the OVO continued its work to identify systemic fairness issues within the Veterans Affairs Portfolio and to advance solutions. The Office published key systemic reports, strengthened its recommendation tracking process, and enhanced its capacity to identify emerging trends related to fairness.
- The OVO published one systemic review, one letter to the Minister, the 2024 Spotlight report, and the 2023–24 Annual Report.
- The Office launched a new systemic review and advanced several ongoing systemic and educational projects aimed at identifying and addressing unfairness in VAC programs and services.
- To improve the accuracy and relevance of its recommendation tracking process, the OVO introduced several important changes:
- The Office added a new “In Progress” category to the Spotlight report to credit work that VAC is actively undertaking but has not yet finalized.
- The OVO implemented a waiting period before tracking new recommendations in the Spotlight, understanding that recommendations take time to implement.
- The Office introduced a validation exercise to review the relevance of older recommendations. As a result of this review, the OVO retired eight recommendations and continued to track 72 active recommendations as of the 2024 Spotlight.
- The OVO collaborated with VAC to identify alternative ways the Department addressed the intent behind certain recommendations, improving the overall quality and fairness of the tracking process.
- The OVO released two key systemic publications focused on addressing gaps and fairness issues within VAC programs and services:
- In February 2025, the Office published a systemic review on Additional Dependant Care reimbursement under the VAC Rehabilitation Program. This review made two recommendations:
- That VAC amends the Veterans Well-being Regulations to allow discretion to exceed the current maximum reimbursement rate when warranted by client circumstances.
- That VAC ensures the regulatory provisions for maximum rates do not result in clients covering an increasing share of dependant care costs over time.
- In May 2024, the OVO published a letter to the Minister recommending that VAC review and revise the policies and regulatory frameworks under the Veterans Independence Program (VIP) to address gaps that place additional burdens on live-in relatives providing care to Veterans with service-related needs.
- In February 2025, the Office published a systemic review on Additional Dependant Care reimbursement under the VAC Rehabilitation Program. This review made two recommendations:
- The OVO strengthened its internal capacity to identify and address fairness issues by implementing the Documentation Guidelines and Fairness Checklist across its complaint analysis processes.
- To improve its ability to identify systemic trends, the Office partnered with VAC IT Services to develop a centralized data system. The OVO will fully implement this system in 2025. Once in place, the system will enable the Office to produce more reliable statistical reports and better detect emerging fairness issues affecting Veterans and their families.
Resources required to achieve results
Table 14: Snapshot of resources required for Veterans Ombudsperson
Table 14 provides a summary of the planned and actual spending and full-time equivalents required to achieve results.
VAC's Finances section of the Infographic on GC Infobase and the People section of the Infographic on GC Infobase provide complete financial and human resources information related to its program inventory.
Related government priorities
This section highlights government priorities that are being addressed through this core responsibility.
Gender-based analysis plus
The OVO continued to apply gender-based analysis plus to all systemic reviews in 2024–25.
- Both systemic publications addressed issues that disproportionately affect women, particularly unpaid caregivers, many of whom are female family members of Veterans.
- The Additional Dependant Care reimbursement systemic review highlighted that female Veterans are more likely to be negatively impacted by the current reimbursement rules due to caregiving patterns.
- The Veterans Independence Program policy gap letter focused on caregiver burden, which disproportionately affects female spouses and family members, and recommended policy changes to help reduce this burden.
United Nations 2030 Agenda for Sustainable Development and the UN Sustainable Development Goals (SDGs)
SDG 5: Gender Equality
- The OVO’s publications addressed fairness gaps with gendered impacts, aligning with Canada’s commitment to gender equality and the recognition of unpaid care work.
- The Additional Dependant Care reimbursement review identified unfairness that disproportionately affects female Veterans and recommended regulatory changes to improve equity in access to rehabilitation benefits.
- The Veterans Independence Program fairness gap letter focused on reducing caregiver burden, an issue that primarily affects women caregivers, and supports broader efforts to mitigate gender inequality in caregiving roles.
More information on VAC’s contributions to Canada’s Federal Implementation Plan on the 2030 Agenda and the Federal Sustainable Development Strategy can be found in the Department’s Departmental Sustainable Development Strategy.
Program inventory
This core responsibility is supported by the following program:
- Veterans Ombudsperson
Additional information related to the program inventory for Veterans Ombudsperson is available on the Results page on GC Infobase.
Internal services
Description
Internal services refer to the activities and resources that support a department in its work to meet its corporate obligations and deliver its programs. The 10 categories of internal services are:
- Management and Oversight Services
- Communications Services
- Legal Services
- Human Resources Management
- Financial Management
- Information Management
- Information Technology
- Real Property
- Materiel
- Acquisitions
Progress on results
This section presents details on how we performed to achieve results for internal services.
In 2024–25, we strengthened internal services by modernizing tools, improving processes, and supporting a more inclusive and agile workforce. These actions helped employees work more efficiently and enhanced our capacity to serve Veterans and their families. We will continue to invest in digital solutions and people-centered practices to ensure internal services remain effective, resilient, and responsive to the needs of the organization.
Digital transformation and information management
- We advanced information management by developing a comprehensive governance framework, increasing training and awareness across the organization, and identifying and addressing gaps to improve record-keeping and data stewardship.
- Work began to consolidate multiple digital workspaces into an integrated, user-friendly solution in 2024–25, with the migration expected to continue into 2025–26 to streamline collaboration and improve productivity.
- New redaction software tools were introduced to enhance the quality and efficiency of Access to Information and Privacy services, improving transparency and responsiveness to public requests.
- A pilot of the Digital and Data Literacy Program was completed to increase staff digital skills. Findings from the pilot will guide the full departmental rollout.
Security and risk management
- A new Departmental Security Plan was implemented to strengthen security awareness through updated training programs, improved screening protocols for employees, and enhanced contract security measures.
- The rollout of a digital personnel security screening solution improved the efficiency, accuracy, and user experience of onboarding new employees while reducing the administrative burden.
- Materiel management was modernized by applying the Directive on Materiel Management and introducing new processes for tracking, storing, and managing surplus holdings. Although progress was slowed by capacity constraints, digital rollout is planned for 2025–26.
- We implemented a renewed approach to risk management, with processes to ensure key strategic risks are being assessed, reviewed, monitored and mitigated on an ongoing basis.
Building internal capacity and leadership
- Building on previous efforts, we progressed development of a Departmental Recruitment and Retention Strategy for Veterans aimed at creating a workplace where Veterans can thrive. This is supported by ongoing work to establish measures needed to effectively monitor our progress.
- We advanced staffing modernization through digital tools that support more agile and responsive hiring practices. Preparations were made to launch the Leadership Excellence and Achievement Program, aimed at building leadership capacity across the department.
Diversity, equity, inclusion, and accessibility
- Inclusive recruitment and retention for students, Veterans, and persons with disabilities were strengthened through focused initiatives, including:
- Participating in the IT Apprenticeship Program for Indigenous Peoples, resulting in successful hires.
- Promoting positive language practices to improve the candidate’s experience.
- Launching a leadership mentorship program for equity-deserving group members.
- Establishing collective recruitment processes tailored to the needs of equity-deserving groups.
- We improved accessibility by migrating our main client system, GCCase, to a cloud-based accessible platform, reducing digital barriers for clients and employees. Barriers in other systems and services were also identified and addressed, and the first Accessibility Progress Report was published.
- Managers were equipped with enhanced tools and resources to support an accessible and inclusive workplace.
- We launched a Departmental Official Languages Action Plan to reinforce its commitment to bilingualism, ensuring that services and communications continue to meet official language requirements.
Employee well-Being and organizational culture
- A new People and Culture Strategy was launched to build future-ready skills and strengthen organizational capacity.
- Employee wellness was supported through targeted mental health training and awareness initiatives.
Strategic communications and outreach
- In 2024–25, communications activities were aligned with the Departmental Strategic Communications Plan, with outreach on raising awareness of our services and reflecting the diversity of Veterans, including Women, Indigenous, and 2SLGBTQI+ Veterans.
- Communications efforts were evidence-based and aligned with strategic priorities, using a Veteran-centric approach to meet audiences where they are and tailoring messaging to diverse experiences and needs.
- Communications were delivered across digital and traditional platforms, including website improvements, accessible advertising, inclusive graphic design, and continued growth of the digital newsletter, Salute!. Internal communications were also enhanced to keep employees informed and engaged.
Driving excellence in performance measurement
- We launched a VAC Community of Practice for Performance Measurement to facilitate the sharing of information, knowledge, and best practices around performance measurement and performance-related roles and responsibilities across the Department.
Resources required to achieve results
Table 15: Snapshot of resources required for Internal Services
Table 15 provides a summary of the planned and actual spending and full-time equivalents required to achieve results.
The Finances section of our Infographic on GC Infobase and the People section of our Infographic on GC Infobase provide complete financial and human resources information related to our program inventory.
Contracts awarded to Indigenous businesses
Government of Canada departments are required to award at least 5% of the total value of contracts to Indigenous businesses every year.
Our result for 2024–25:
Table 16: Total value of contracts awarded to Indigenous businesses“Contract” is a binding agreement for the procurement of a good, service, or construction and does not include real property leases. It includes contract amendments and contracts entered into by means of acquisition cards of more than $10,000.00.
As shown in the Table 16, we awarded 7.77% of the total value of all contracts to Indigenous businesses for the fiscal year.
In 2024–25, we took several steps to support and increase procurement with Indigenous businesses. We took part in a reverse industry day hosted by Public Services and Procurement Canada that focused on Indigenous suppliers. We also identified and started working with new Indigenous businesses for commonly used services like language training and simultaneous interpretation. To guide our efforts, we follow an internal policy that directs us to engage Indigenous suppliers first whenever possible.
When we plan a procurement, we take steps to identify Indigenous businesses that may be able to deliver the goods or services we need. We search the Indigenous Business Directory, connect with Indigenous Services Canada, do internet searches, and issue requests for information. These actions help us understand the Indigenous supplier landscape and support informed decisions, including when considering a deputy head exception. In 2024–25, we applied exceptions in two cases: one was an $8.38 million amendment to an existing contract where switching suppliers wasn’t an option, and the other was a $711 million competitively sourced contract for the Federal Health Claims Processing Service, which includes an Indigenous Participation Plan.
In our 2025–26 Departmental Plan, we estimated that we would award 5.6% of the total value of our contracts to Indigenous businesses by the end of 2024–25.
Spending and human resources
-
In this section
Spending
This section presents an overview of our actual and planned expenditures from 2022–23 to 2027–28.
Refocusing Government Spending
In Budget 2023, the government committed to reducing spending by $14.1 billion over five years, starting in 2023–24, and by $4.1 billion annually after that.
As part of meeting this commitment, we identified the following spending reductions.
- 2024–25: $6,387,000
- 2025–26: $8,848,500
- 2026–27 and after: $11,500,000
During 2024–25, we worked to realize these reductions through the following measures:
- Reducing Travel and Professional Services
- Reducing capacity in areas that provide indirect services or support (these reductions will not directly impact front line services to Veterans and their families)
Budgetary performance summary
Table 17: Actual three-year spending on core responsibilities and internal services (dollars)
Table 17 shows the money that we spent in each of the past three years on our core responsibilities and on internal services.
Analysis of the past three years of spending
We build our annual budget to respond to Veterans in need of benefits and services. A key part of this process is forecasting, which helps ensure there is enough funding for all eligible Veterans who are likely to need help in a given year. Our annual budget fluctuates each year due to the demand-driven nature of our programs—based on Veterans’ needs and entitlements. In other words, a Veteran who is entitled to a benefit or service receives it.
While forecasting helps ensure enough funding is available, expenditures are only incurred for Veterans who in fact come forward to use the program or service. The budget process accounts for these fluctuations, which is why there will be changes. The design of the Government’s budget process accounts for these fluctuations, which is why there will be changes to both forecasted and actual spending from one year to the next. Fluctuations in spending are normal, given that initial forecasting is typically done many months in advance of the reporting period and adjusted throughout the year based on actual results. In addition, due to timing, new spending announced in recent Federal Budgets are not included in the planned spending figures. As shown in the tables, we spent $7.6 billion in 2024–25, of which over 94% represented payments to Veterans, their families, and other program recipients. Total spending was $1.6B higher than the year before (2023–24). When comparing actual spending to planned spending for 2024–25, actual spending was greater than planned by approximately $1.4B. The increase is explained below:
Benefits, Services and Support
- Increased spending is attributed to the cumulative increase in clients accessing our programs that have a lifelong benefit, combined with increased demand for certain programs. Additionally, increased spending occurred as a result of settlement payments made in relation to the Manuge class action.
Commemoration
- Increased spending to commemorate significant Canadian military milestones, including the 80th anniversary of D-Day and events recognizing modern-day Veterans. Additional funding was also provided to support the Juno Beach Centre in preserving the legacy of all Canadians who served in the Second World War.
Veterans Ombudsman
- Planned spending was in line with actual spending.
Internal Services
- Increased spending in key areas that supported departmental operations and priorities. These included modernizing information technology tools and software to improve automation, support ongoing modernization efforts, and enhance service delivery to Veterans. Furthermore, increased spending occurred in relation to the Manuge class action.
The Finances section of our Infographic on GC Infobase offers more financial information from previous years.
Table 18: Planned three-year spending on core responsibilities and internal services (dollars)
Table 18 shows our planned spending for each of the next three years on our core responsibilities and on internal services.
Analysis of the next three years of spending
In the upcoming fiscal years, we anticipate planned spending to exhibit a variable trend – initially increasing in 2025–26, followed by a decrease over the two subsequent years.
Although the table above indicates a decline in planned spending for the coming years, this is based on forecasts developed well in advance of the reporting period due to the nature of the budgeting process. More recent forecast models suggest an increase in demand for many programs and services in the coming years, consistent with past trends. Planned spending for 2026–27 and 2027–28 will be updated in future years to incorporate the latest projections, bringing them more in line with 2025–26 levels. Veterans' benefits remain unaffected.
The Finances section of our Infographic on GC Infobase offers more financial information from previous years.
Funding
This section provides an overview of our voted and statutory funding for our core responsibilities and for internal services. Consult the Government of Canada budgets and expenditures for further information on funding authorities.
Graph 1: Approved funding (statutory and voted) over a six-year period (dollars)
Graph 1 summarizes our approved voted and statutory funding from 2022–23 to 2027–28.
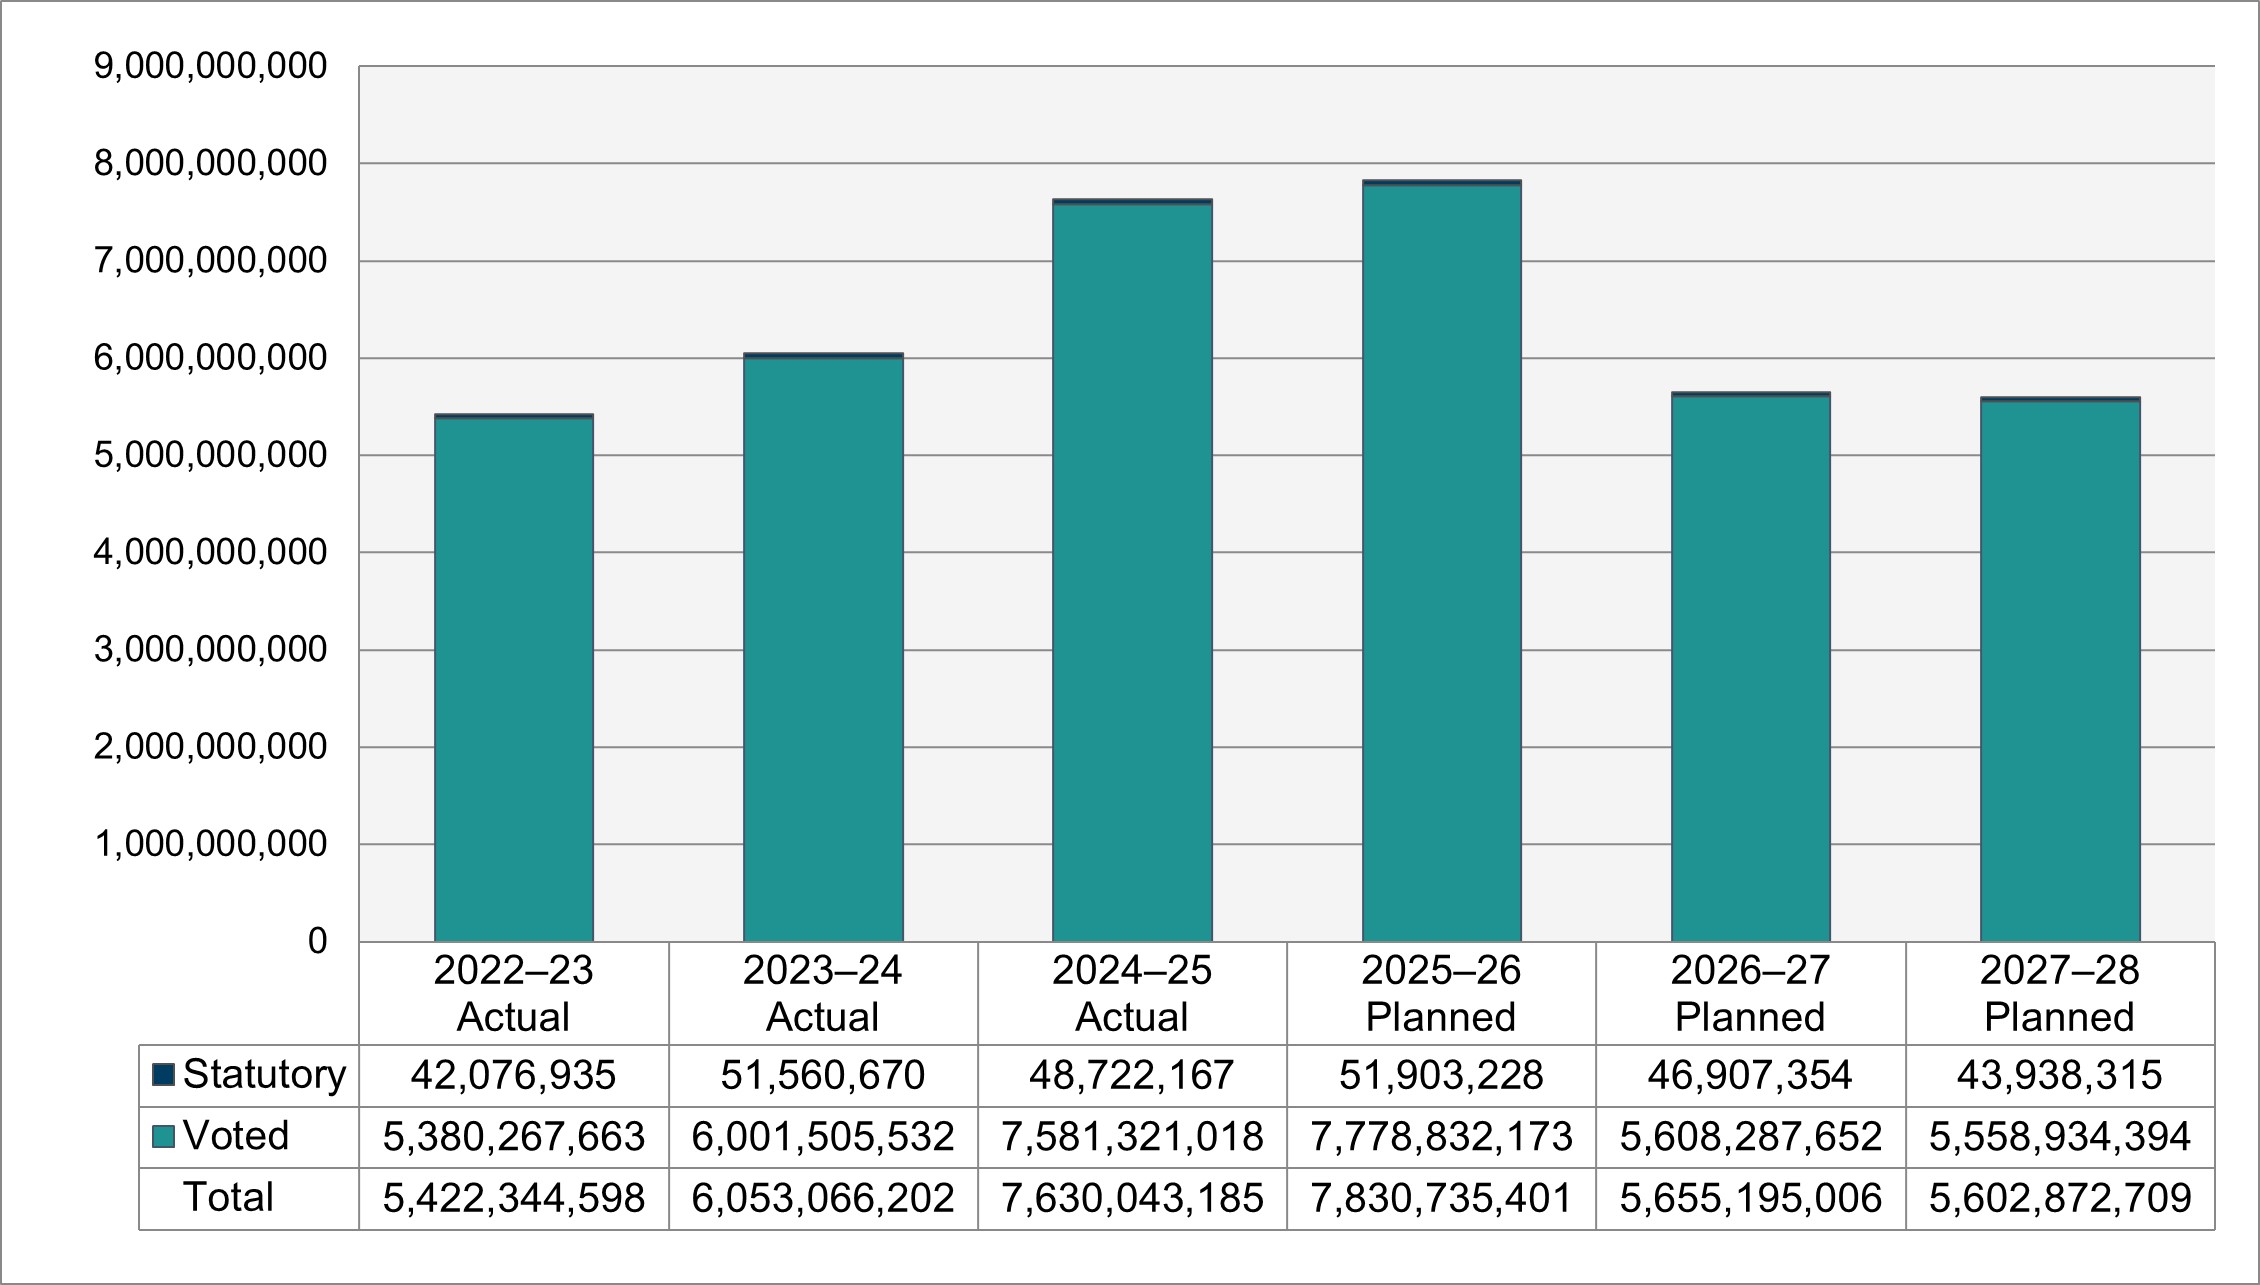
Text version of Graph (dollars)
Consult the Public Accounts of Canada for further information on our departmental voted and statutory expenditures.
Financial statement highlights
Our Financial Statements (unaudited) for the Year Ended 31 March 2025.
Table 19: Condensed Statement of Operations (unaudited) for the year ended 31 March 2025 (dollars)
Table 19 summarizes the expenses and revenues for 2024–25 which net to the cost of operations before government funding and transfers.
Analysis of expenses and revenues for 2024–25
Our actual total departmental expenses were approximately $993 million higher than we forecasted for 2024–25. This variance stems from the demand-driven nature of our programs, which adjust to the real-time needs of Veterans and their families. Because these needs fluctuate year over year, expenditures reflect that variability.
The 2024–25 planned results information is provided in our Future-Oriented Statement of Operations and Notes 2024–25.
Table 20: Condensed Statement of Operations (unaudited) for 2023–24 and 2024–25 (dollars)
Table 20 summarizes actual expenses and revenues and shows the net cost of operations before government funding and transfers.
Analysis of differences in expenses and revenues between 2023–24 and 2024–25
In 2024–25, we spent $1.2 billion more than in the previous fiscal year. This increase reflects rising demand for our programs and services, which continue to adapt to the changing needs of Veterans and their families. These programs are structured to remain flexible and responsive, ensuring support is available when and where it is needed.
Table 21: Condensed Statement of Financial Position (unaudited) as of 31 March 2025 (dollars)
Table 21 provides a brief snapshot of the amounts we owe or must spend (liabilities) and our available resources (assets), which helps to indicate our ability to carry out programs and services.
Analysis of our liabilities and assets since last fiscal year
In 2024–25, total net liabilities decreased by $322 million compared to 2023–24, primarily from the settlement of a litigation claim. During the same period, total net financial assets increased by $78 million, driven primarily by a higher amount due from the Consolidated Revenue Fund. As a result, departmental net debt, which reflects the difference between net liabilities and net financial assets, decreased by $400 million. Additionally, total non-financial assets rose by $2 million, largely due to the construction of tangible capital assets.
Human resources
This section presents an overview of our actual and planned human resources from 2022–23 to 2027–28.
Table 22: Actual human resources for core responsibilities and internal services
Table 22 shows a summary in full-time equivalents of human resources for our core responsibilities and for our internal services for the previous three fiscal years.
Analysis of human resources over the last three years
The planned FTE count was 39 lower than the actual number of FTEs, representing a variance within 1% of planned. In 2024–25, we continued to prioritize Service Excellence initiatives and worked to reduce processing times for disability applications, enhancing services for Veterans and their families. Additionally, we focused on sustaining frontline staffing levels, including maintaining the Case Manager-to-Veteran ratio.
The planned amounts for future years reflect the figures presented in the Main Estimates and do not include any additional funding approved during the current fiscal year. We received in-year funding for initiatives that were not part of the Departmental Plans.
Table 23: Human resources planning summary for core responsibilities and internal services
Table 23 shows the planned full-time equivalents for each of our core responsibilities and for our internal services for the next three years. Human resources for the current fiscal year are forecast based on year to date.
Analysis of human resources over the next three years
In 2025–26, we will work on a number of actions to reduce the backlog of disability benefit applications and to make decisions faster for Veterans and their families. Funding for Service Excellence initiatives, which was originally announced in the Government’s Economic and Fiscal Snapshot of August 2020, has been extended to the end of fiscal year 2025–26.
Temporary funding for Case Management Renewal will begin in 2025–26 and continue until the end of 2026–27. This initiative aims to enhance and modernize case management services for Veterans.
While funding for human resource levels may revert to pre-Service Excellence and Case Management Renewal levels in 2027–28, we will continue to reassess our long-term capacity to ensure ongoing improvements in services to Veterans and their families.
Supplementary information tables
The following supplementary information tables are available at the following links:
Federal tax expenditures
The tax system can be used to achieve public policy objectives through the application of special measures such as low tax rates, exemptions, deductions, deferrals and credits. The Department of Finance Canada publishes cost estimates and projections for these measures each year in the Report on Federal Tax Expenditures. This report also provides detailed background information on tax expenditures, including descriptions, objectives, historical information and references to related federal spending programs as well as evaluations and GBA Plus of tax expenditures.
Corporate information
Departmental profile
Appropriate minister:
The Honourable Jill McKnight, PC, MP
Institutional head:
Paul Ledwell, Deputy Minister
Ministerial portfolio:
Veterans Affairs
Enabling instruments:
Department of Veterans Affairs Act; Veterans Well-being Act; Pension Act
For more information on these and other related acts and regulations, please refer to our Legislation page.
Year of incorporation / commencement:
1923
Departmental contact information
Mailing address
Veterans Affairs Canada
P.O. Box 7700
Charlottetown, PE
C1A 8M9
Telephone:
1-866-522-2122
TTY:
1-833-921-0071
Website:
Mailing address
Veterans Ombud
P.O. Box 66
Charlottetown, PE
C1A 7K2
Telephone:
1-877-330-4343
TTY:
1-833-978-1639
Website:
Definitions
List of terms
- appropriation (crédit)
- Any authority of Parliament to pay money out of the Consolidated Revenue Fund.
- budgetary expenditures (dépenses budgétaires)
- Operating and capital expenditures; transfer payments to other levels of government, departments or individuals; and payments to Crown corporations.
- core responsibility (responsabilité essentielle)
- An enduring function or role of a department. The departmental results listed for a core responsibility reflect the outcomes that the department seeks to influence or achieve.
- Departmental Plan (plan ministériel)
- A report that outlines the anticipated activities and expected performance of an appropriated department over a 3-year period. Departmental Plans are usually tabled in Parliament in spring.
- departmental priority (priorité)
- A plan, project or activity that a department focuses and reports on during a specific planning period. Priorities represent the most important things to be done or those to be addressed first to help achieve the desired departmental results.
- departmental result (résultat ministériel)
- A high-level outcome related to the core responsibilities of a department.
- departmental result indicator (indicateur de résultat ministériel)
- A quantitative or qualitative measure that assesses progress toward a departmental result.
- departmental results framework (cadre ministériel des résultats)
- A framework that connects the department’s core responsibilities to its departmental results and departmental result indicators.
- Departmental Results Report (rapport sur les résultats ministériels)
- A report outlining a department’s accomplishments against the plans, priorities and expected results set out in the corresponding Departmental Plan.
- Full‑time equivalent (équivalent temps plein)
- Measures the person years in a departmental budget. An employee's scheduled hours per week divided by the employer's hours for a full-time workweek calculates a full-time equivalent. For example, an employee who works 20 hours in a 40-hour standard workweek represents a 0.5 full-time equivalent.
- Gender-based Analysis Plus (GBA Plus) (analyse comparative entre les sexes plus [ACS Plus])
- An analytical tool that helps to understand the ways diverse individuals experience policies, programs and other initiatives. Applying GBA Plus to policies, programs and other initiatives helps to identify the different needs of the people affected, the ways to be more responsive and inclusive, and the methods to anticipate and mitigate potential barriers to accessing or benefitting from the initiative. GBA Plus goes beyond biological (sex) and socio-cultural (gender) differences to consider other factors, such as age, disability, education, ethnicity, economic status, geography (including rurality), language, race, religion, and sexual orientation.
- government priorities (priorités pangouvernementales)
- For the purpose of the 2024–25 Departmental Results Report, government priorities are the high-level themes outlining the government’s agenda as announced in the 2021 Speech from the Throne.
- horizontal initiative (initiative horizontale)
- A program, project or other initiative where two or more federal departments receive funding to work collaboratively on a shared outcome usually linked to a government priority, and where the ministers involved agree to designate it as horizontal. Specific reporting requirements apply, including that the lead department must report on combined expenditures and results.
- Indigenous business (entreprise autochtones)
- For the purposes of a Departmental Result Report, this includes any entity that meets the Indigenous Services Canada’s criteria of being owned and operated by Elders, band and tribal councils, registered in the Indigenous Business Directory or registered on a modern treaty beneficiary business list.
- non‑budgetary expenditures (dépenses non budgétaires)
- Net outlays and receipts related to loans, investments and advances, which change the composition of the financial assets of the Government of Canada.
- performance (rendement)
- What a department did with its resources to achieve its results, how well those results compare to what the department intended to achieve, and how well lessons learned have been identified.
- performance indicator (indicateur de rendement)
- A qualitative or quantitative measure that assesses progress toward a departmental-level or program-level result, or the expected outputs or outcomes of a program, policy or initiative.
- plan (plan)
- The articulation of strategic choices, which provides information on how a department intends to achieve its priorities and associated results. Generally, a plan will explain the logic behind the strategies chosen and tend to focus on actions that lead to the expected result.
- planned spending (dépenses prévues)
- For Departmental Plans and Departmental Results Reports, planned spending refers to the amounts presented in Main Estimates. Departments must determine their planned spending and be able to defend the financial numbers presented in their Departmental Plans and Departmental Results Reports.
- program (programme)
- An Individual, group, or combination of services and activities managed together within a department and focused on a specific set of outputs, outcomes or service levels.
- program inventory (répertoire des programmes)
- A listing that identifies all the department’s programs and the resources that contribute to delivering on the department’s core responsibilities and achieving its results.
- result (résultat)
- An outcome or output related to the activities of a department, policy, program or initiative.
- statutory expenditures (dépenses législatives)
- Spending approved through legislation passed in Parliament, other than appropriation acts. The legislation sets out the purpose and the terms and conditions of the expenditures.
- target (cible)
- A quantitative or qualitative, measurable goal that a department, program or initiative plans to achieve within a specified time period.
- voted expenditures (dépenses votées)
- Spending approved annually through an appropriation act passed in Parliament. The vote also outlines the conditions that govern the spending.